Charts · Models
Charts and models
Pick a category, pick a chart. Standard indicators, alongside original charts and models. Here, you can truly be your own analyst.
No charts match.
-
BTC Spot
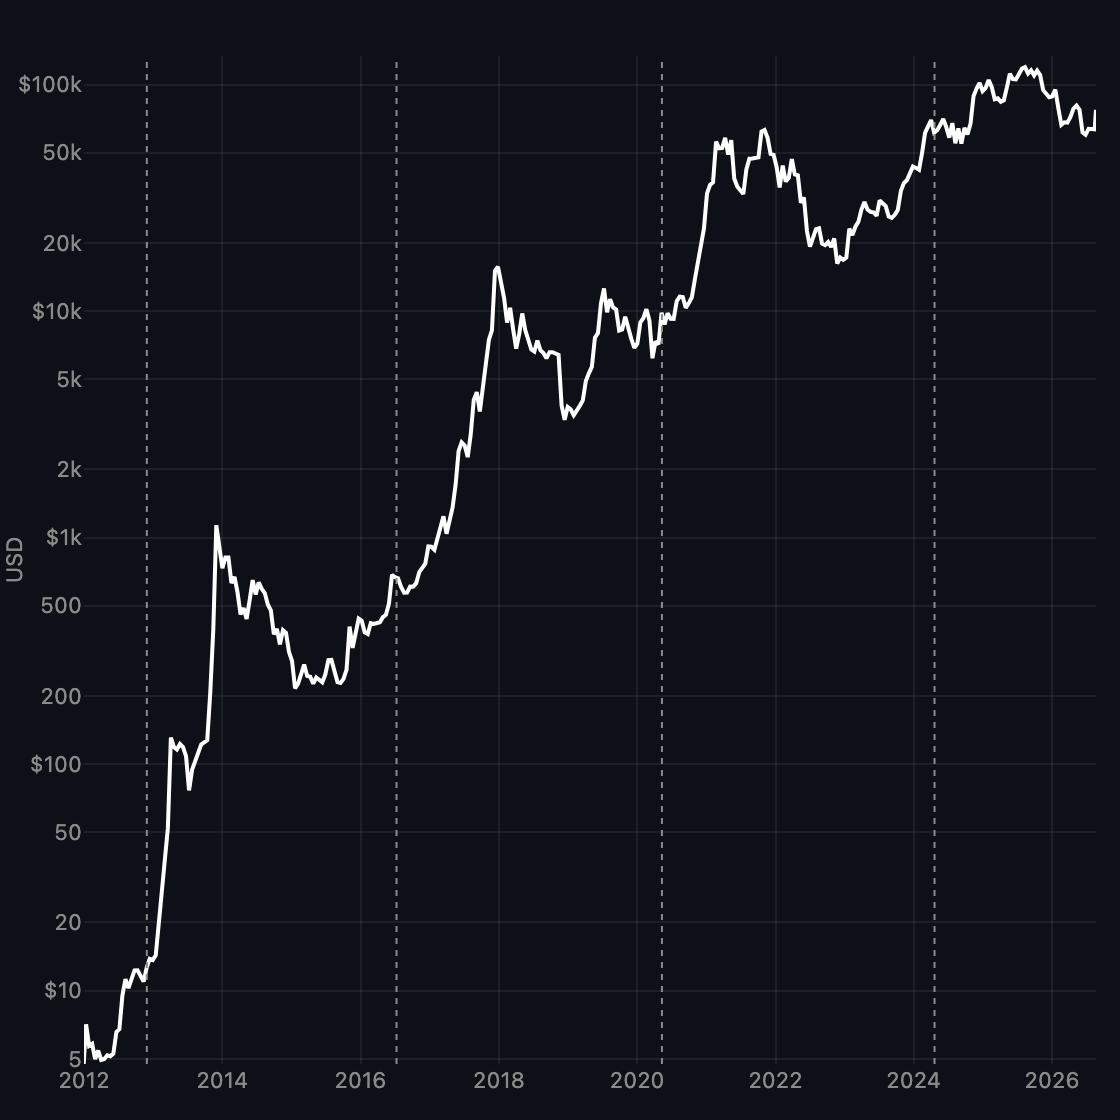
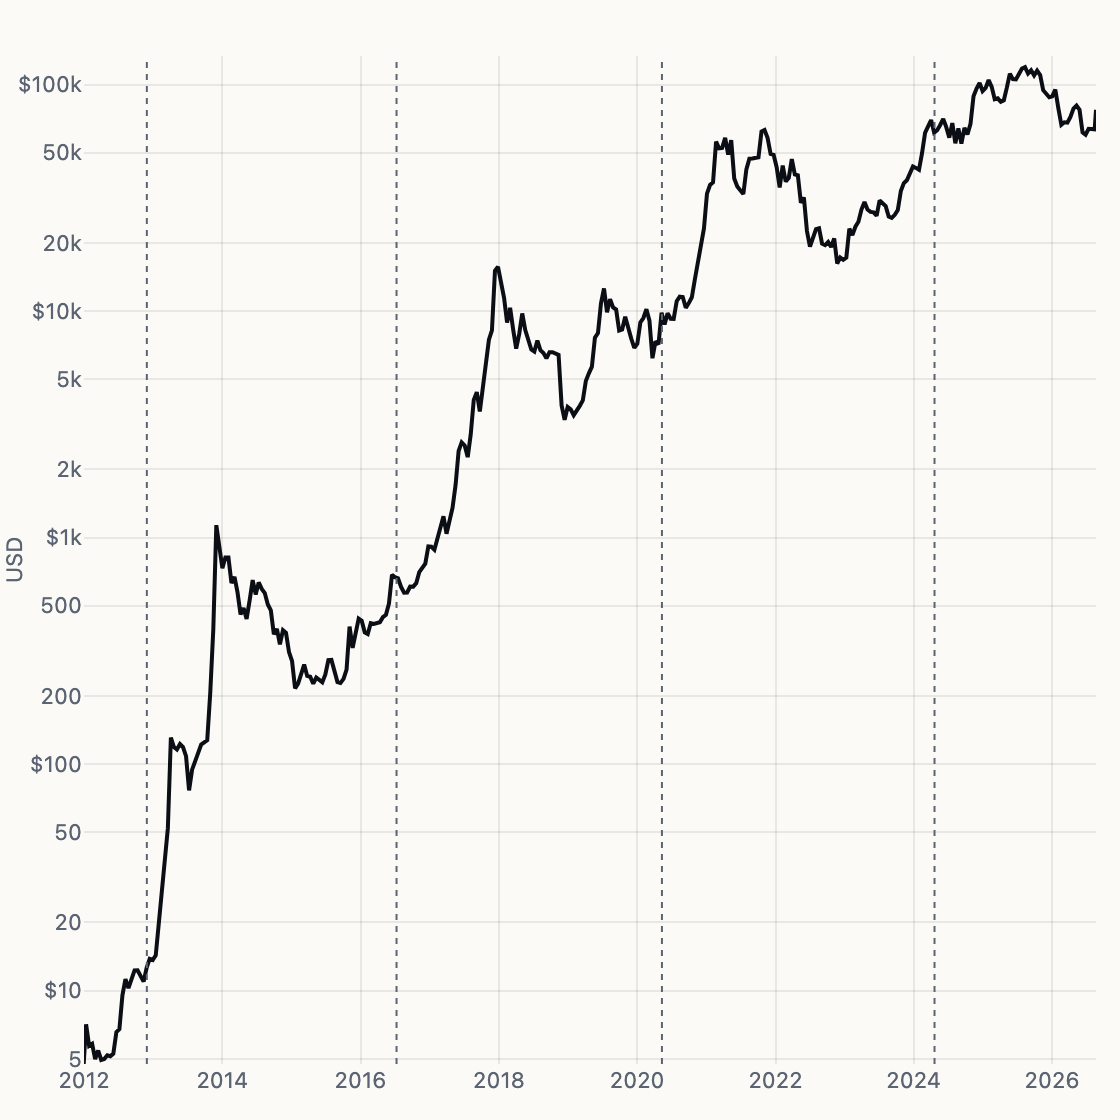
Log USD spot price of Bitcoin — the research baseline.
-
Cycle Structure
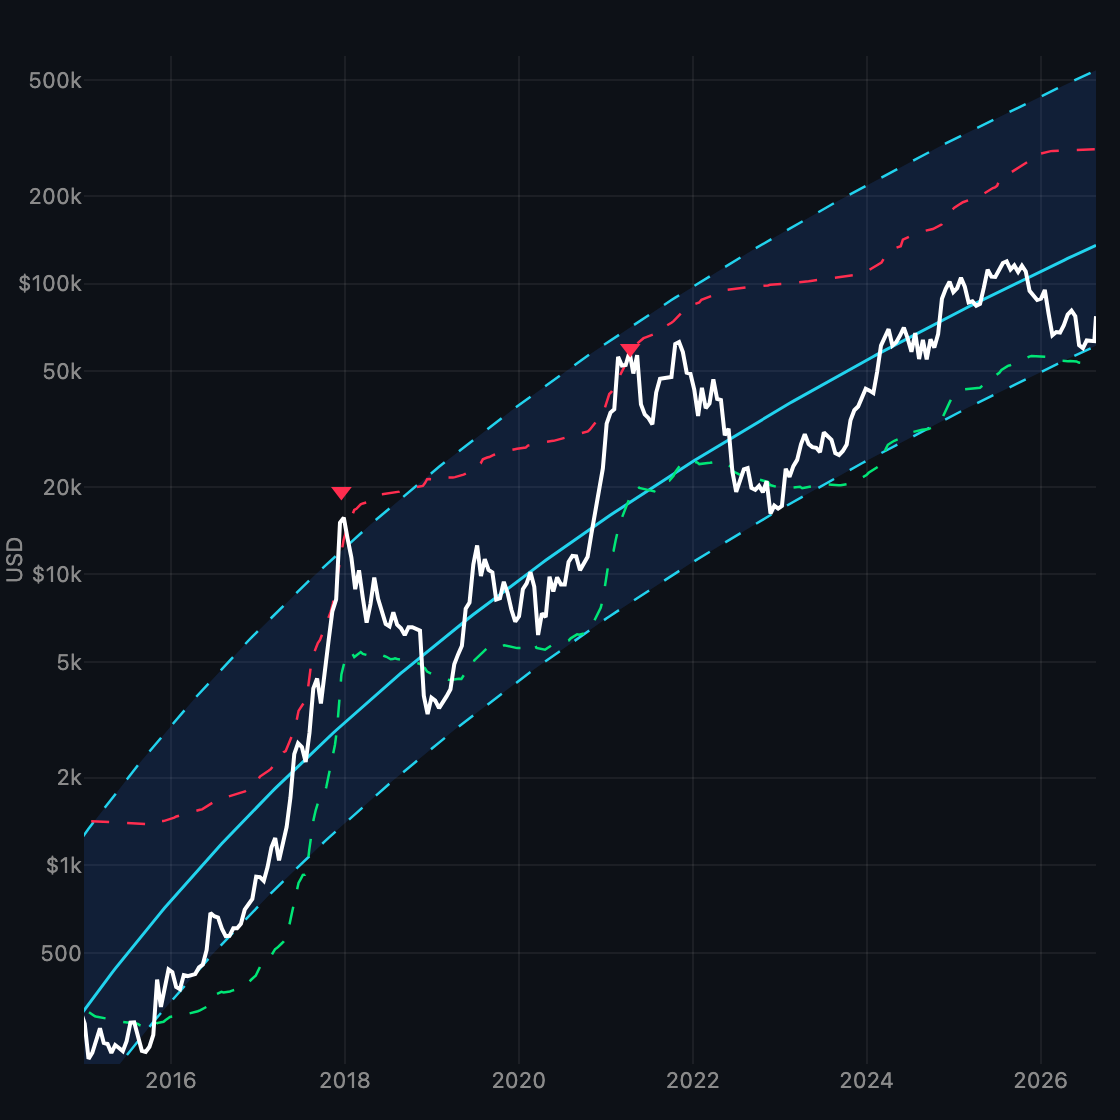
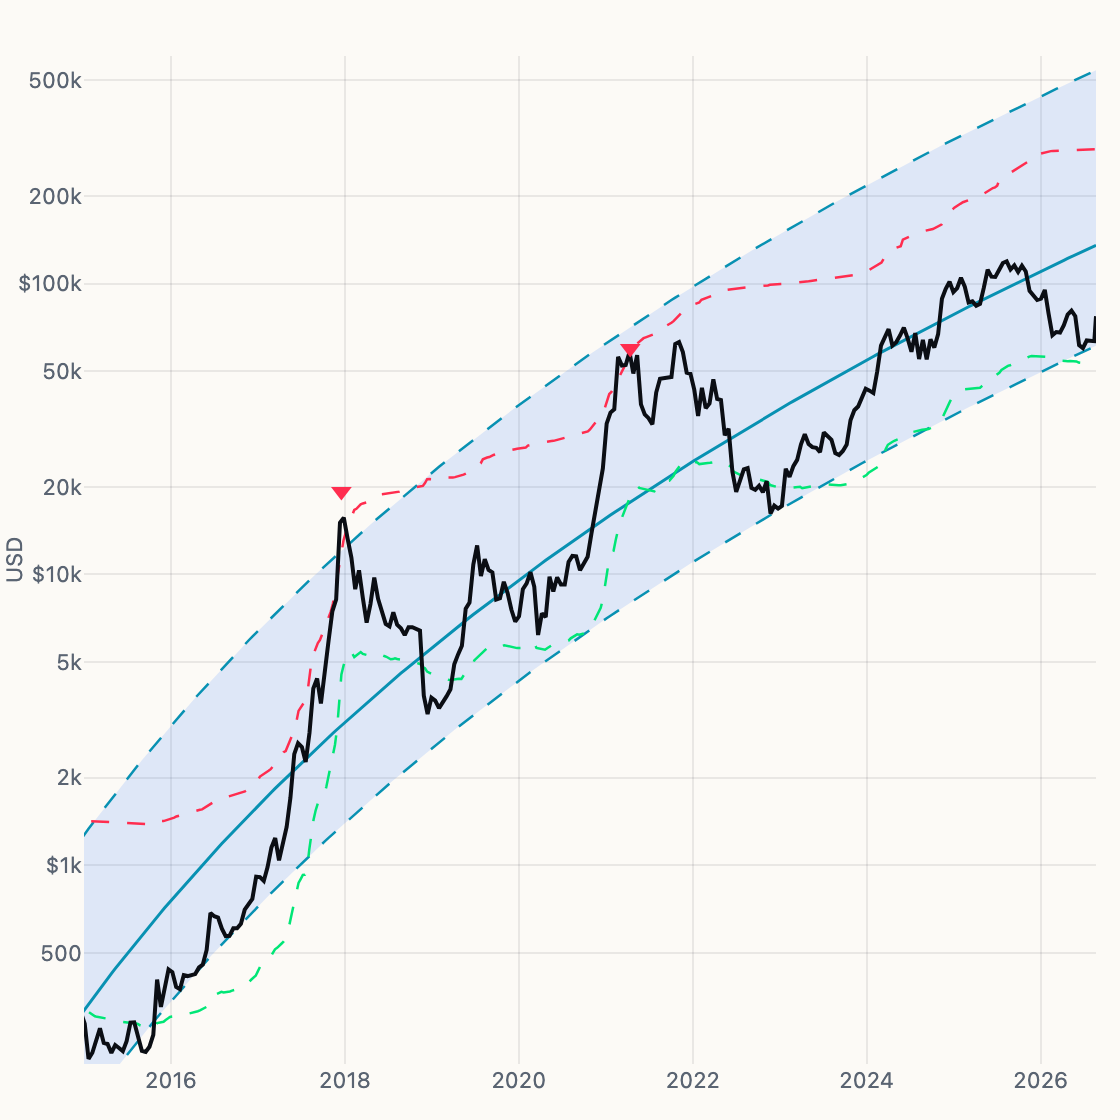
Spot inside the power-law corridor with realized, terminal, and Pi tops.
-
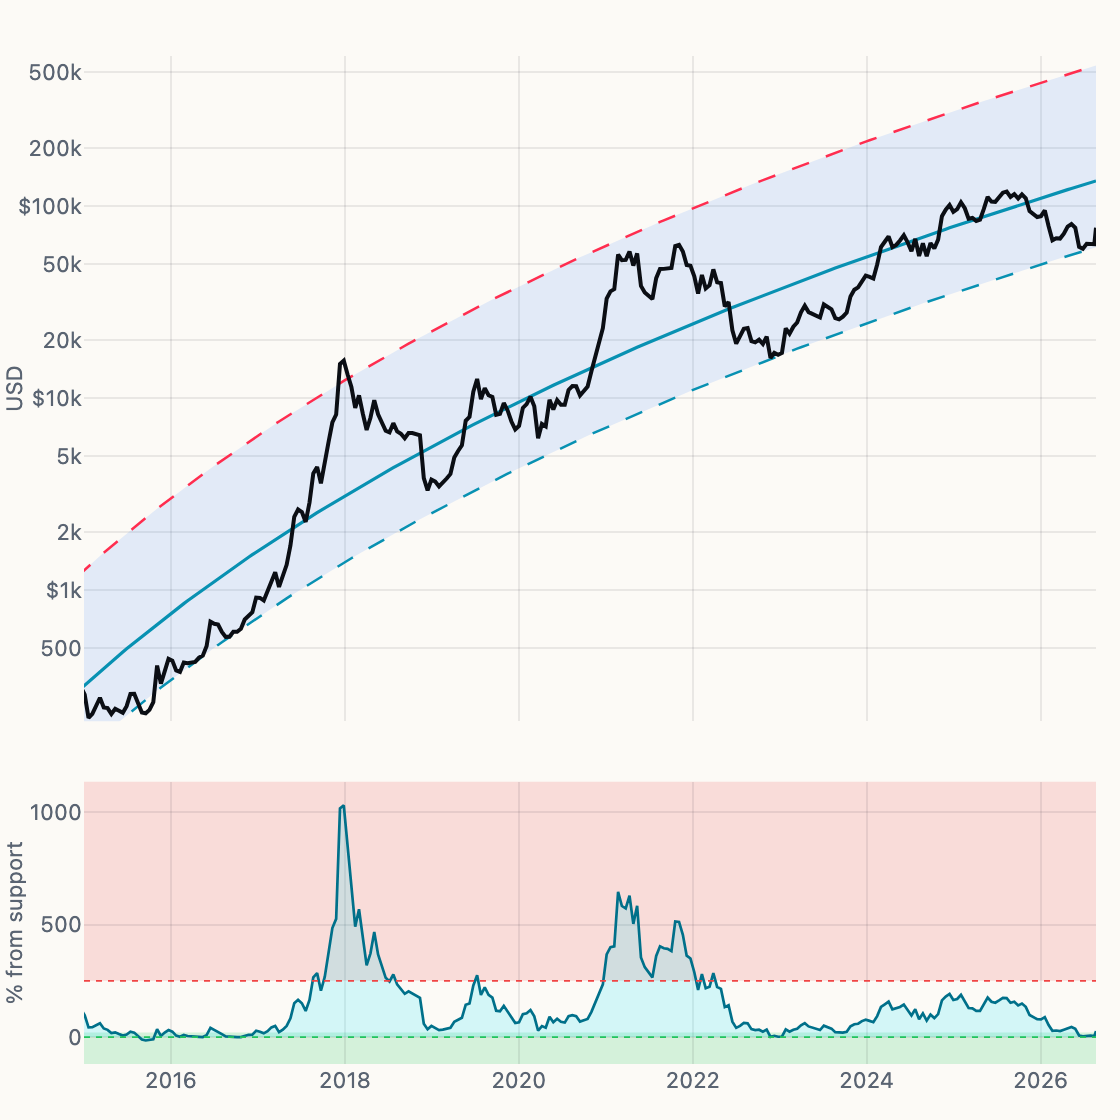
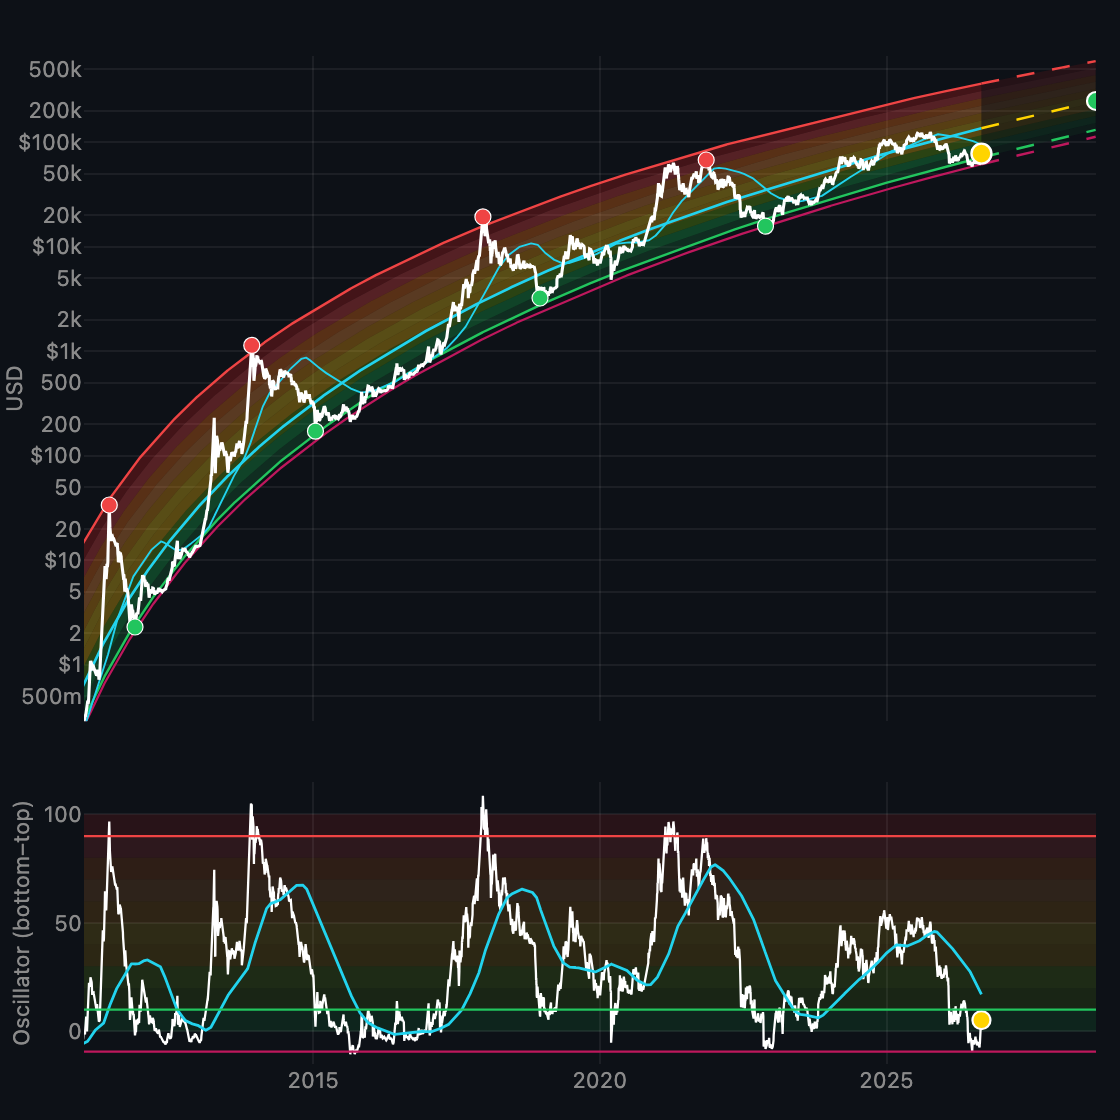
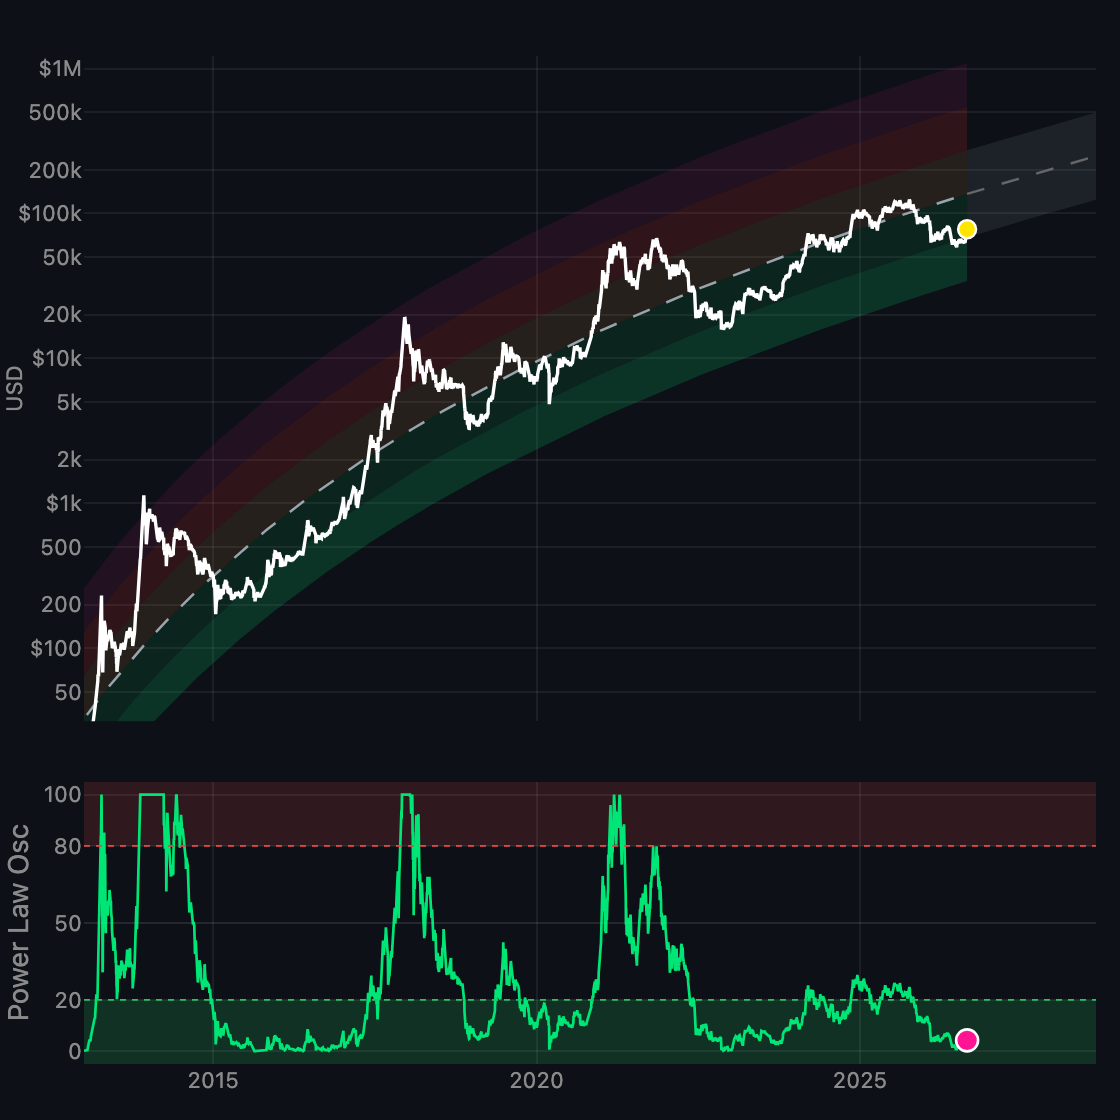
Power-Law Trend
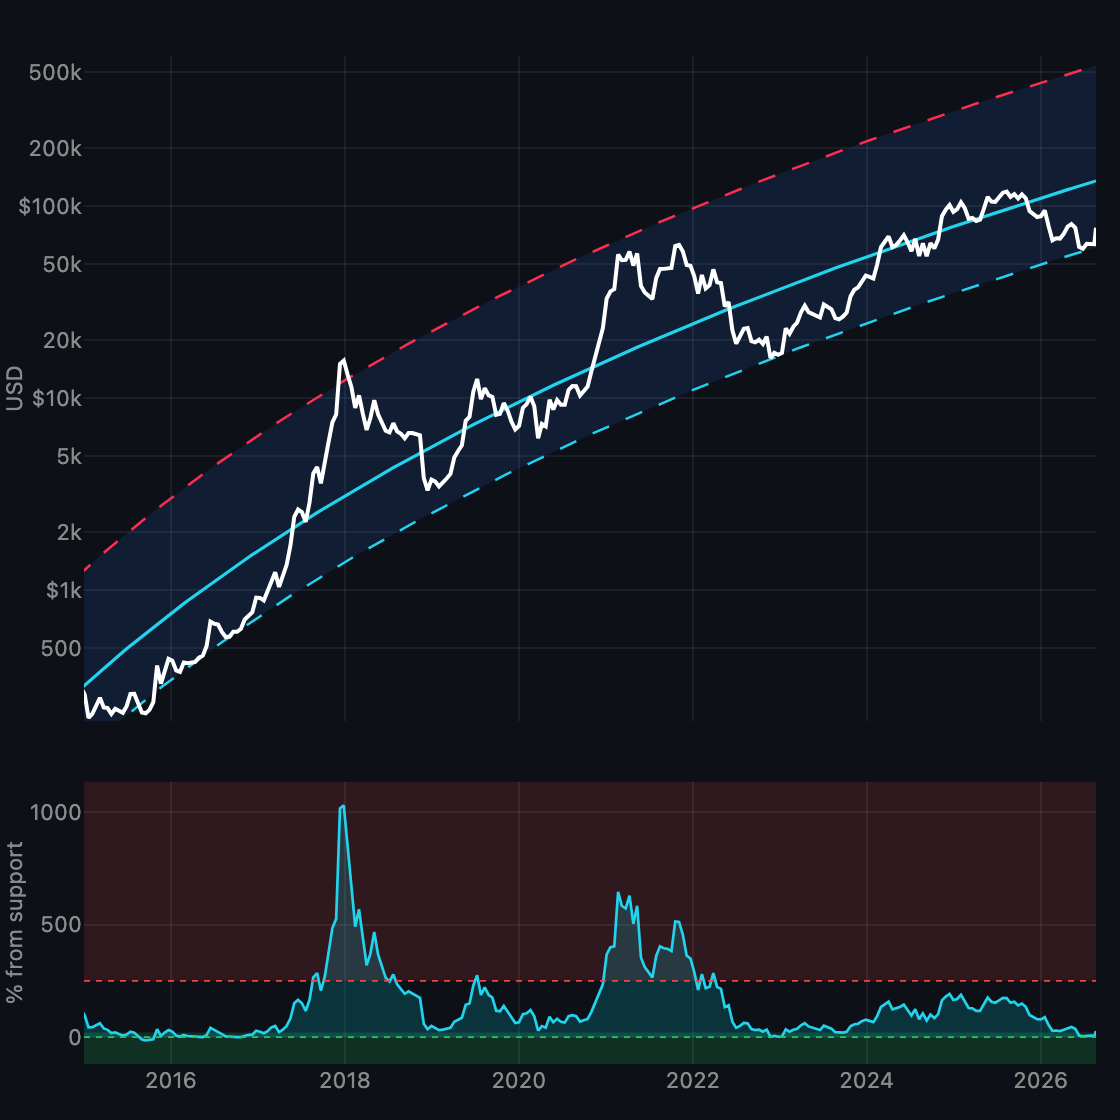
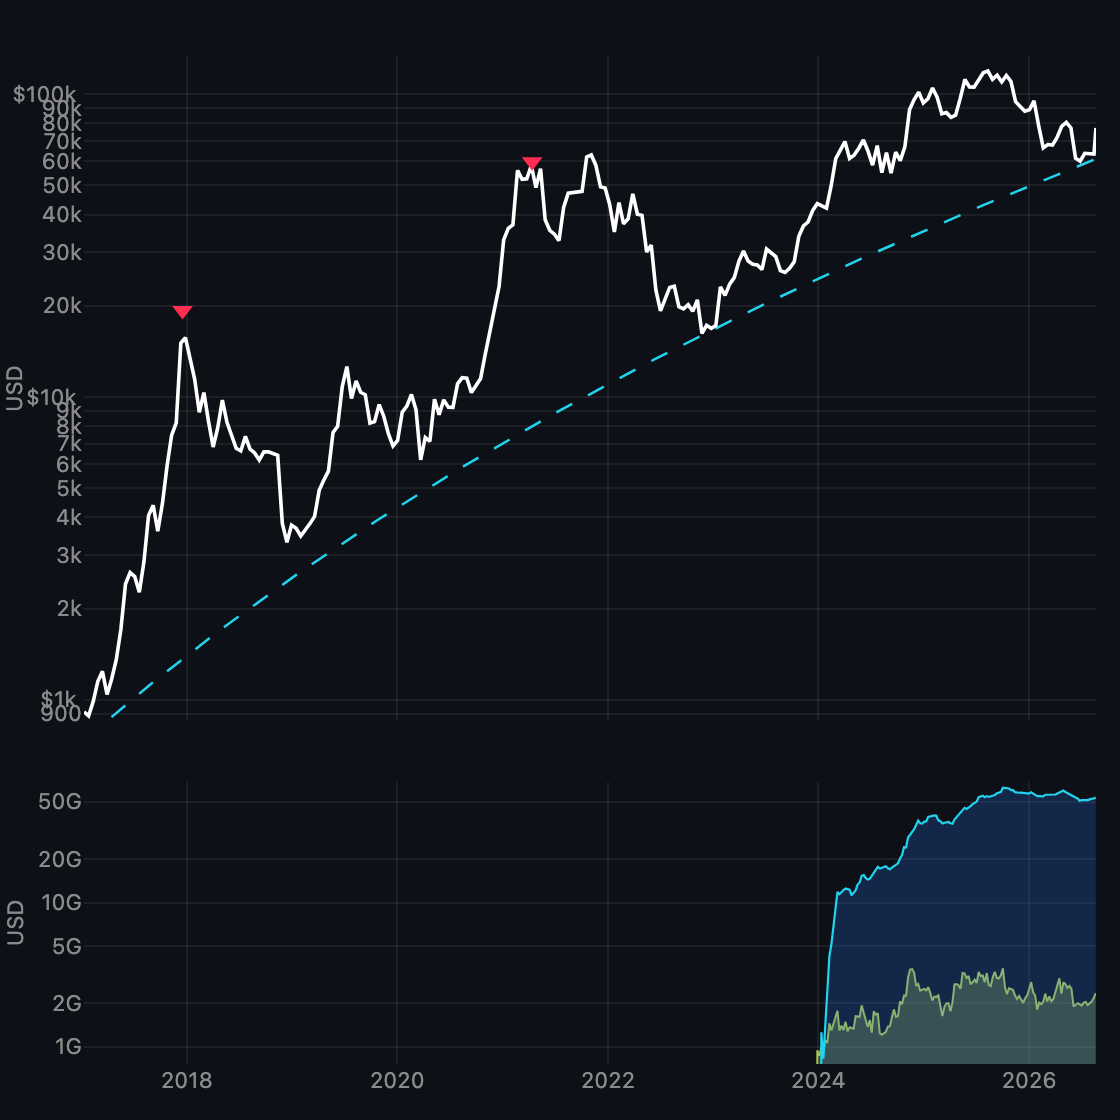
OLS trend with support/ceiling bands and % above support.
-
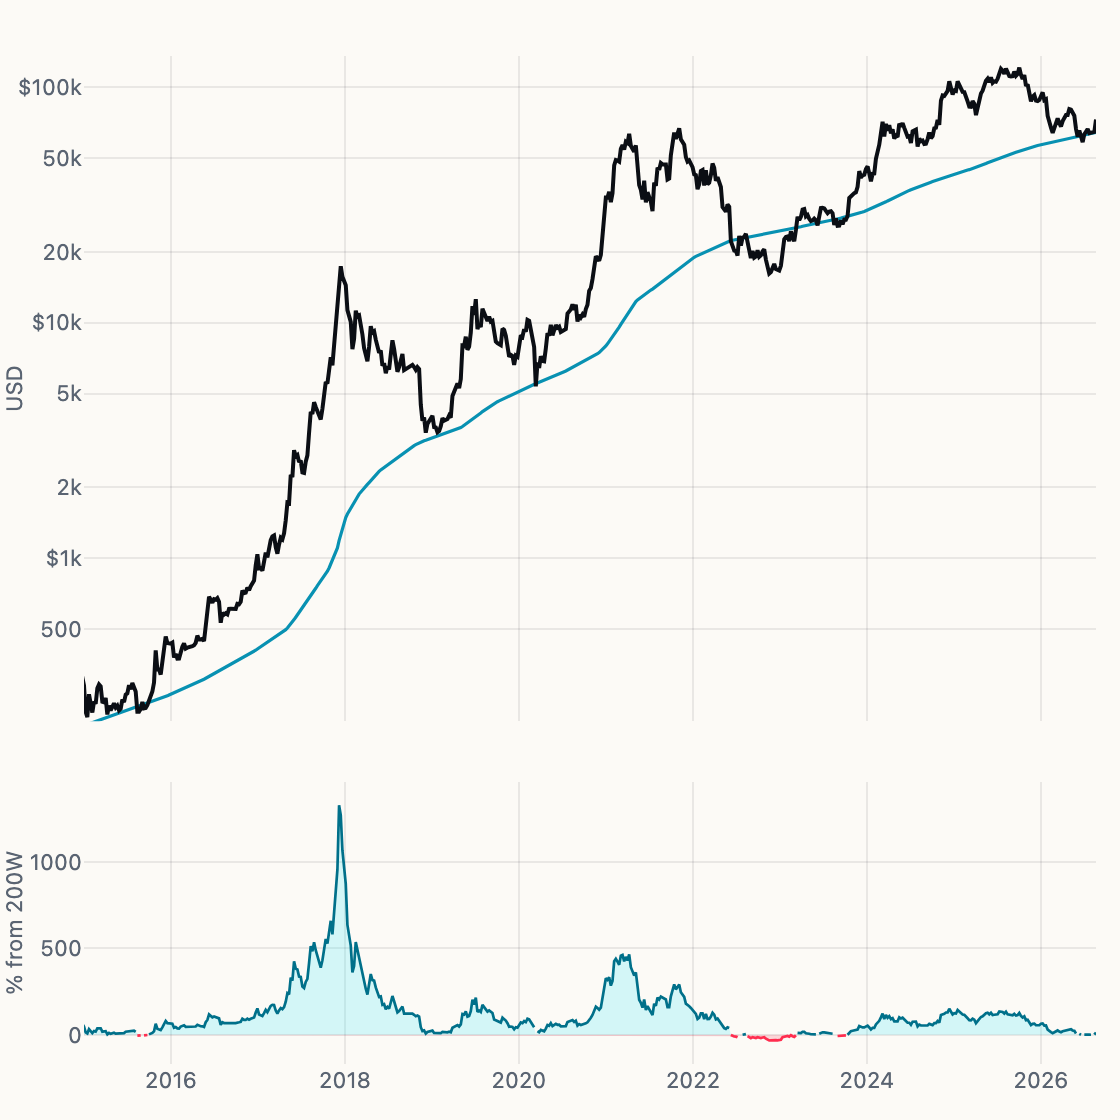
200-Week SMA
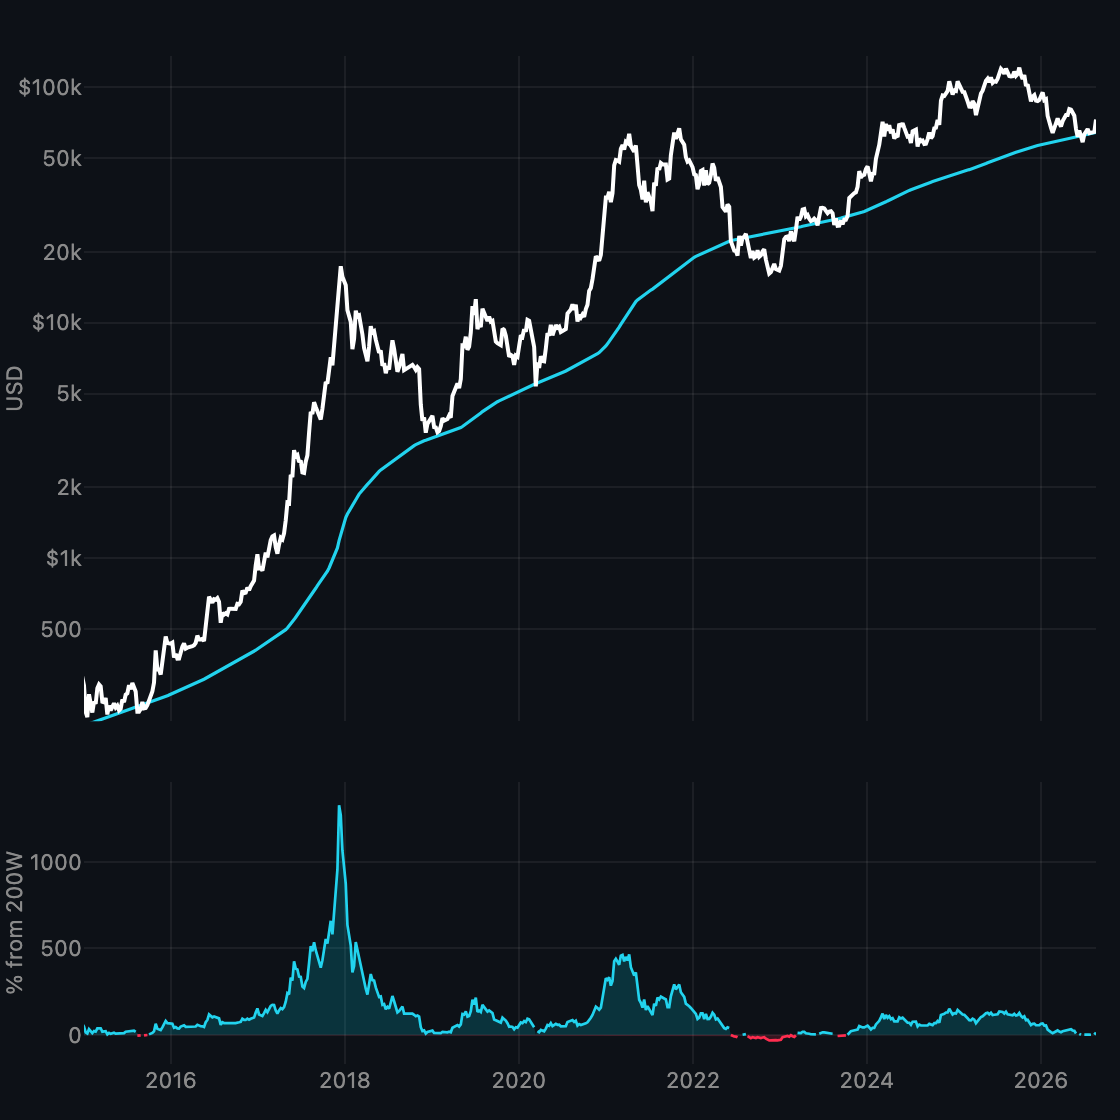
Macro floor: price vs the 200-week moving average.
-
Realized / Terminal
Spot, realized cost basis, and terminal — with a 0–100 oscillator between them.
-
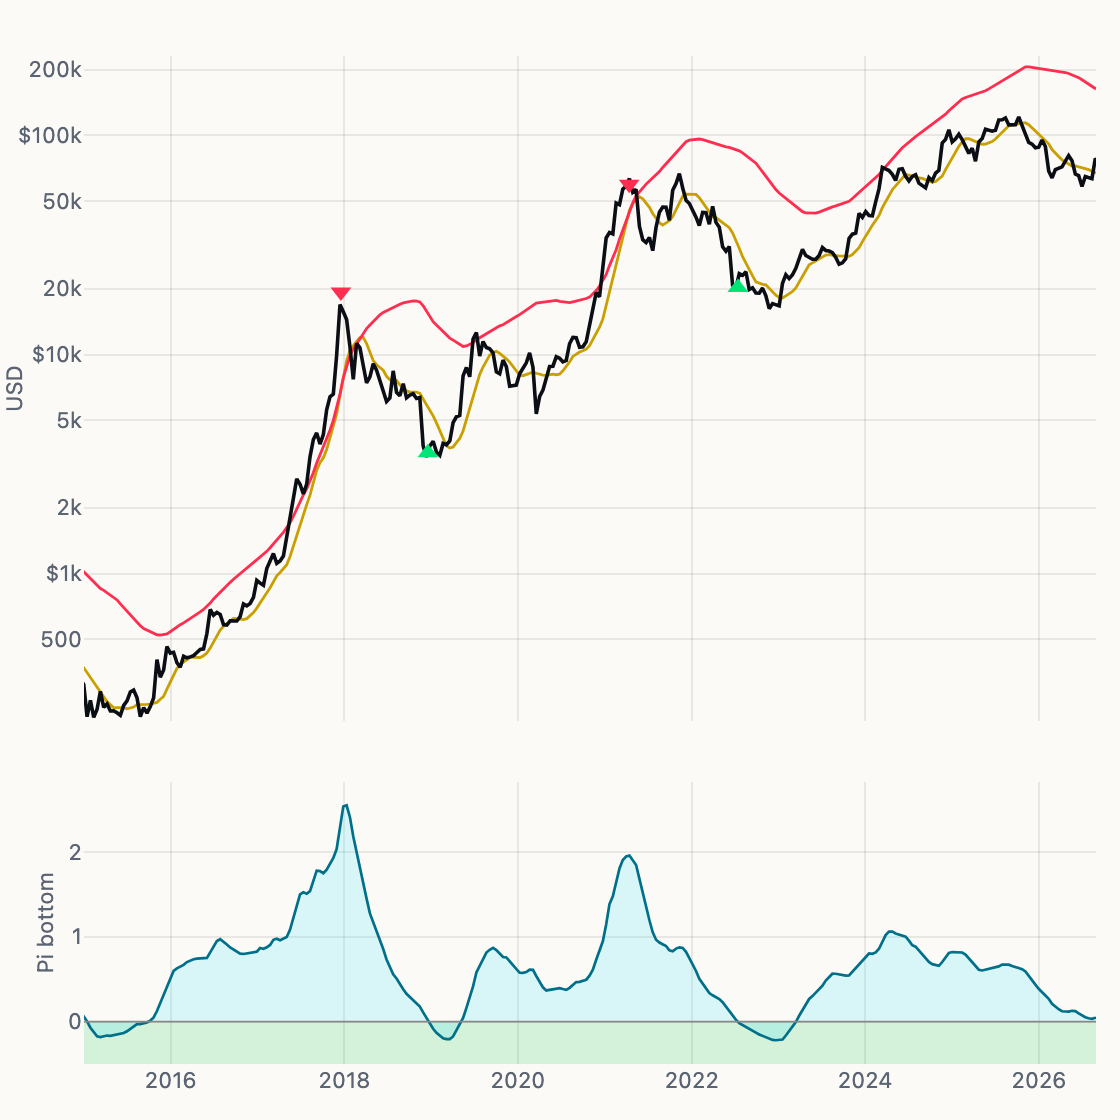
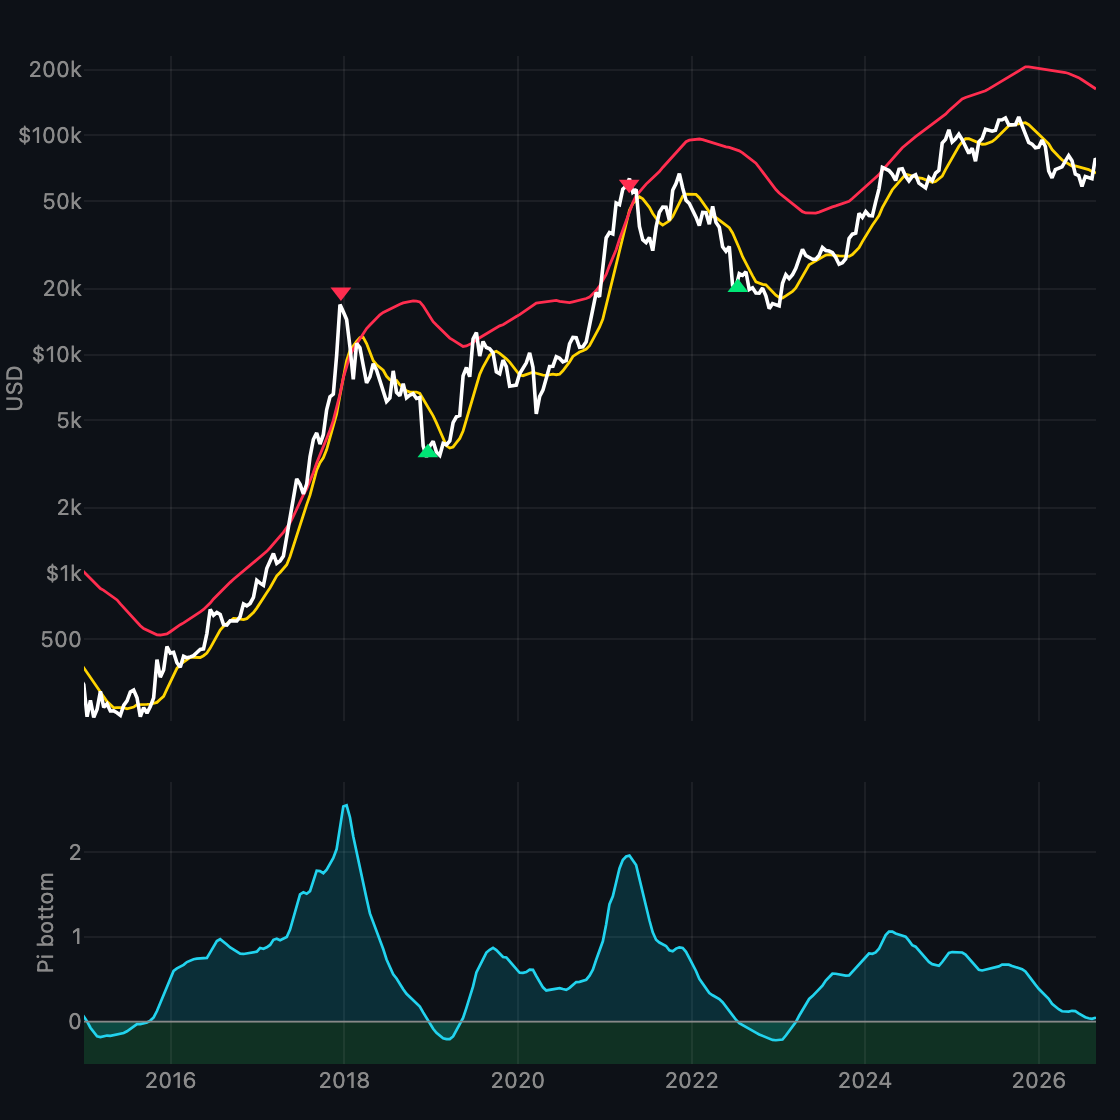
Pi Cycle
Pi Cycle Top (111 / 2×350) with Pi Cycle Bottom (150 EMA / 471×0.745).
-
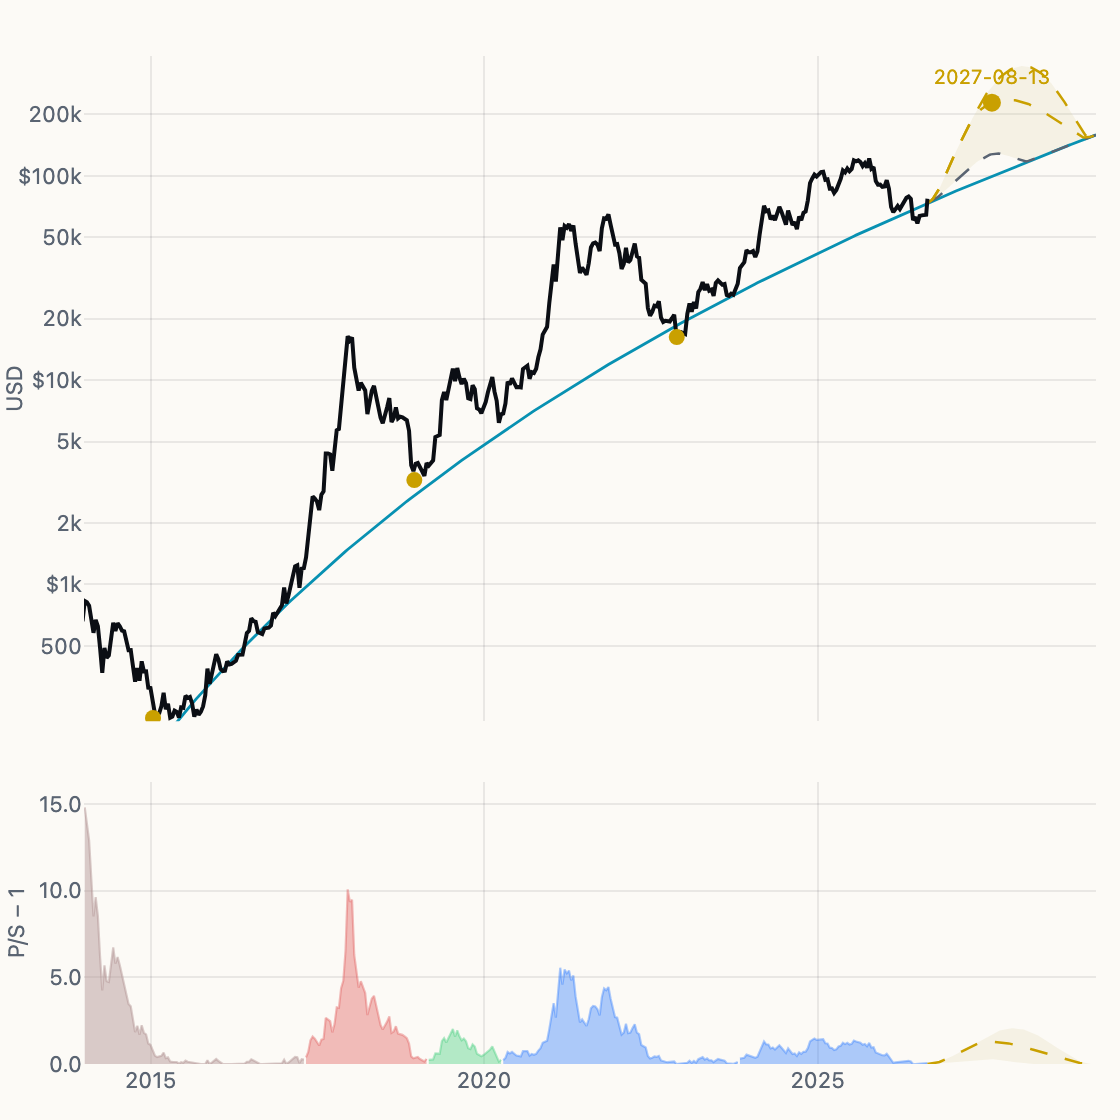
Cycle Scenarios
Quantile floor with bear/base/bull path arcs.
-
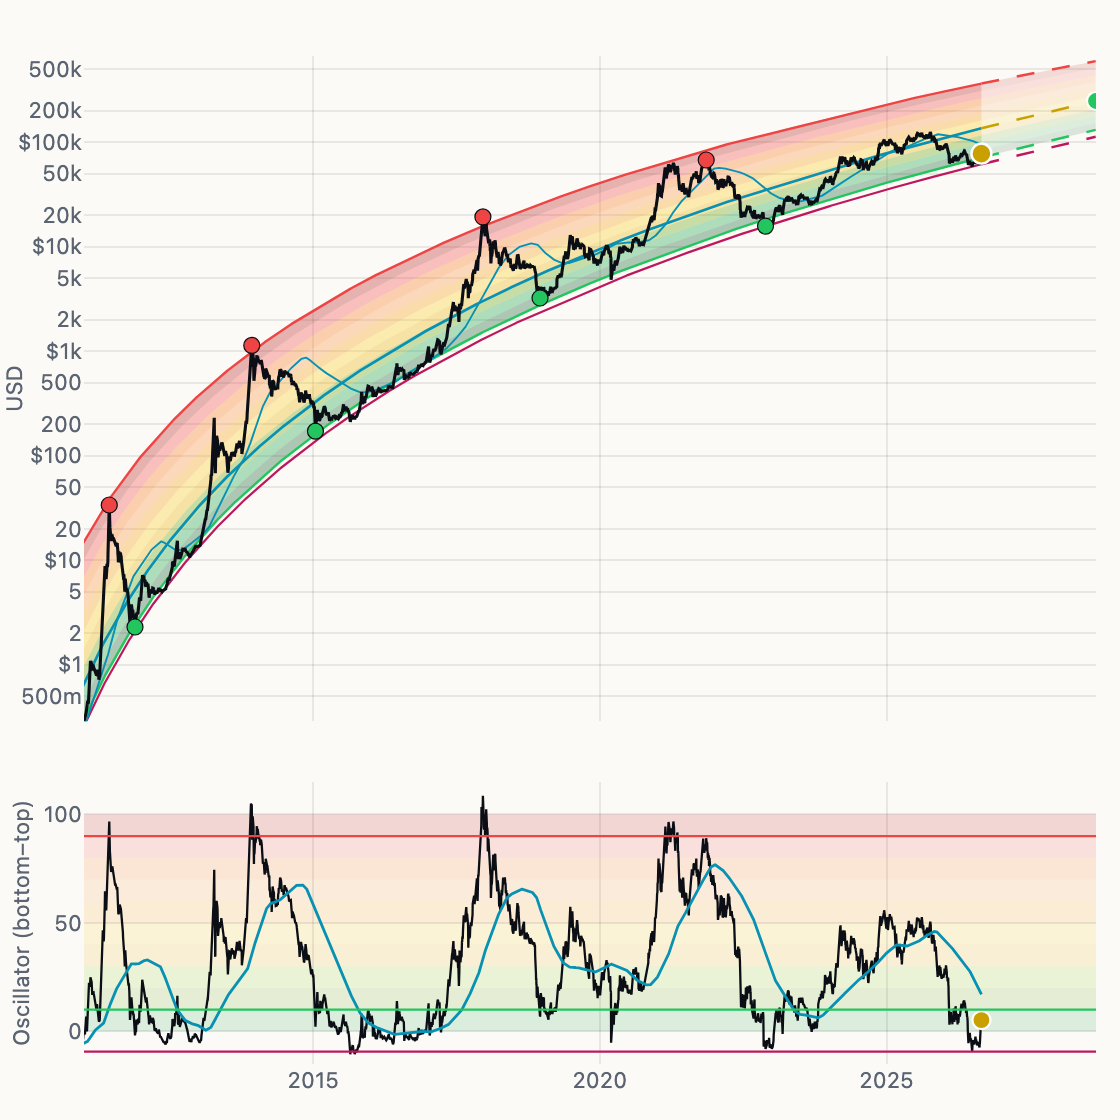
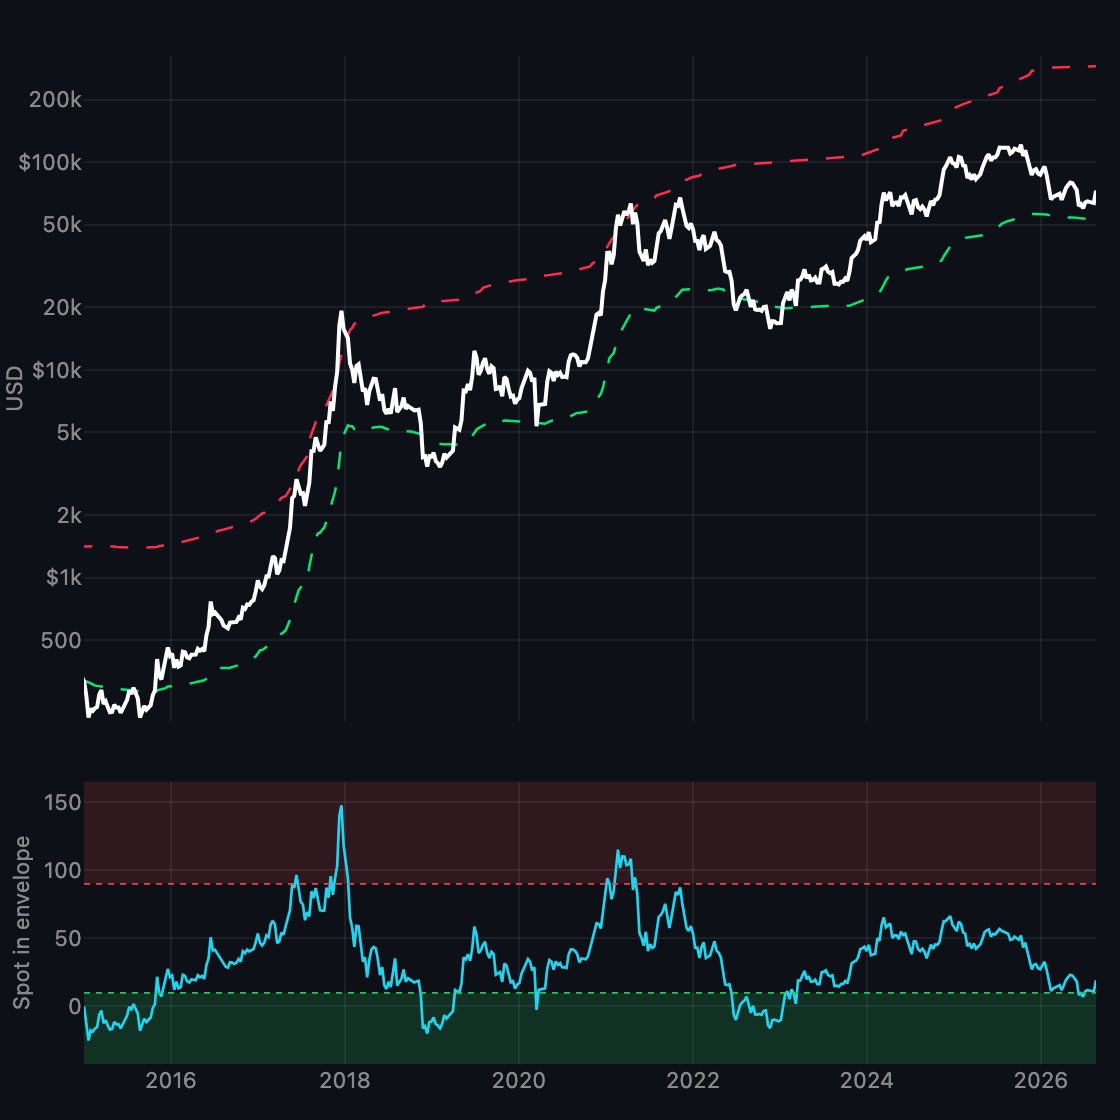
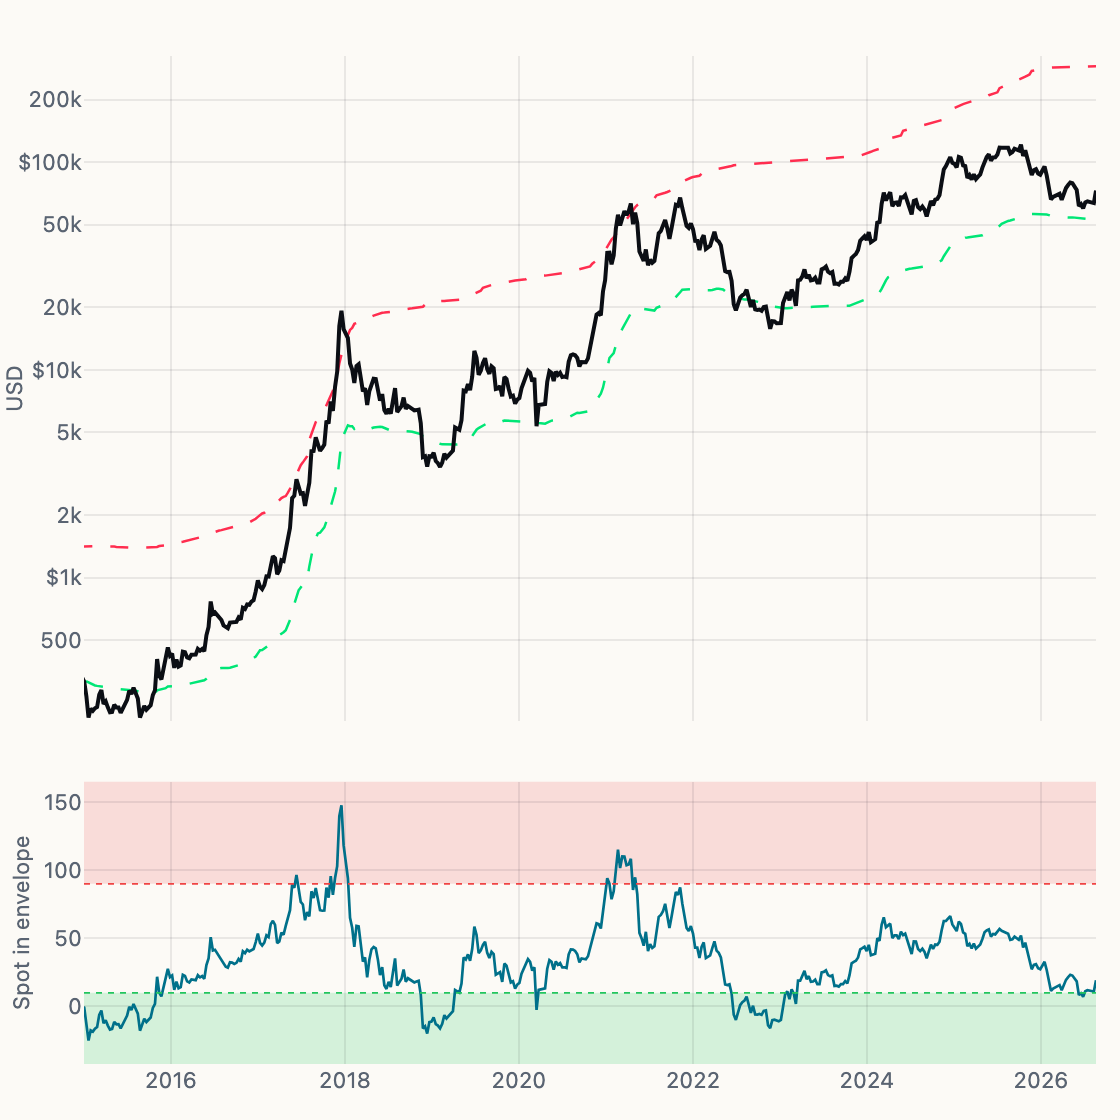
Cycle Envelope
Cycle-high and cycle-low power laws with a 0–100 envelope oscillator.
-
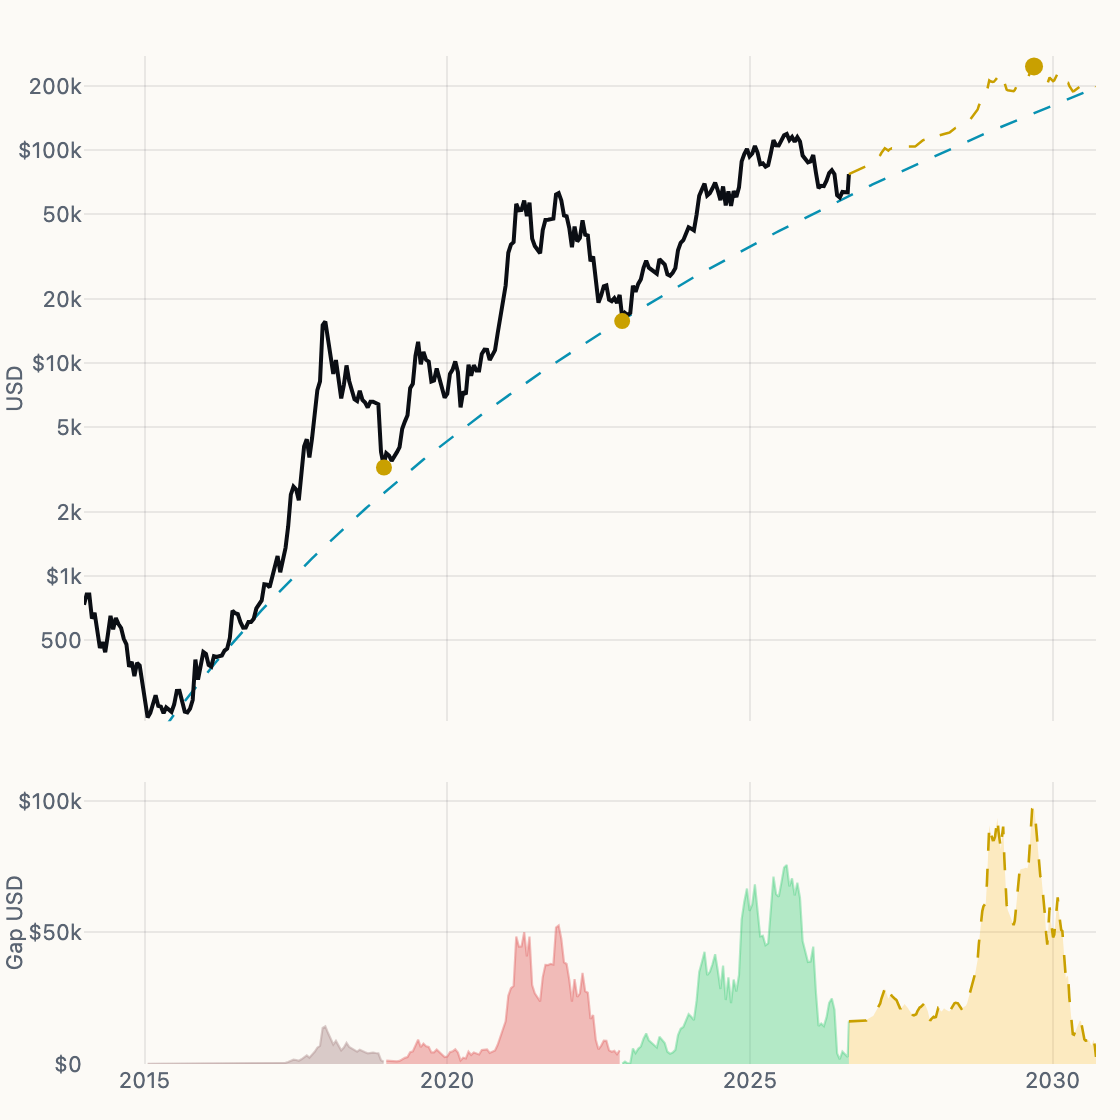
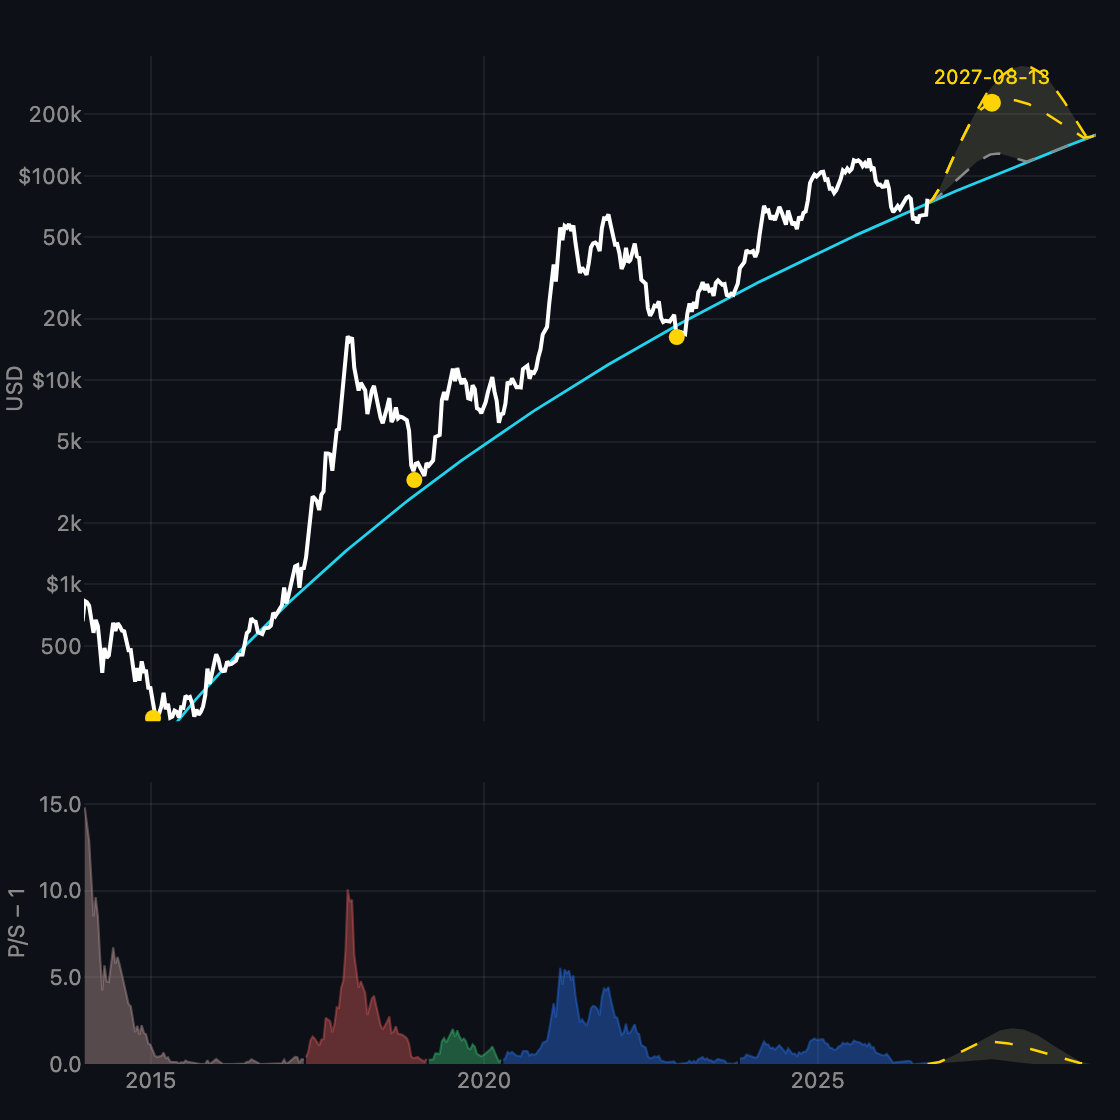
Floor Gap
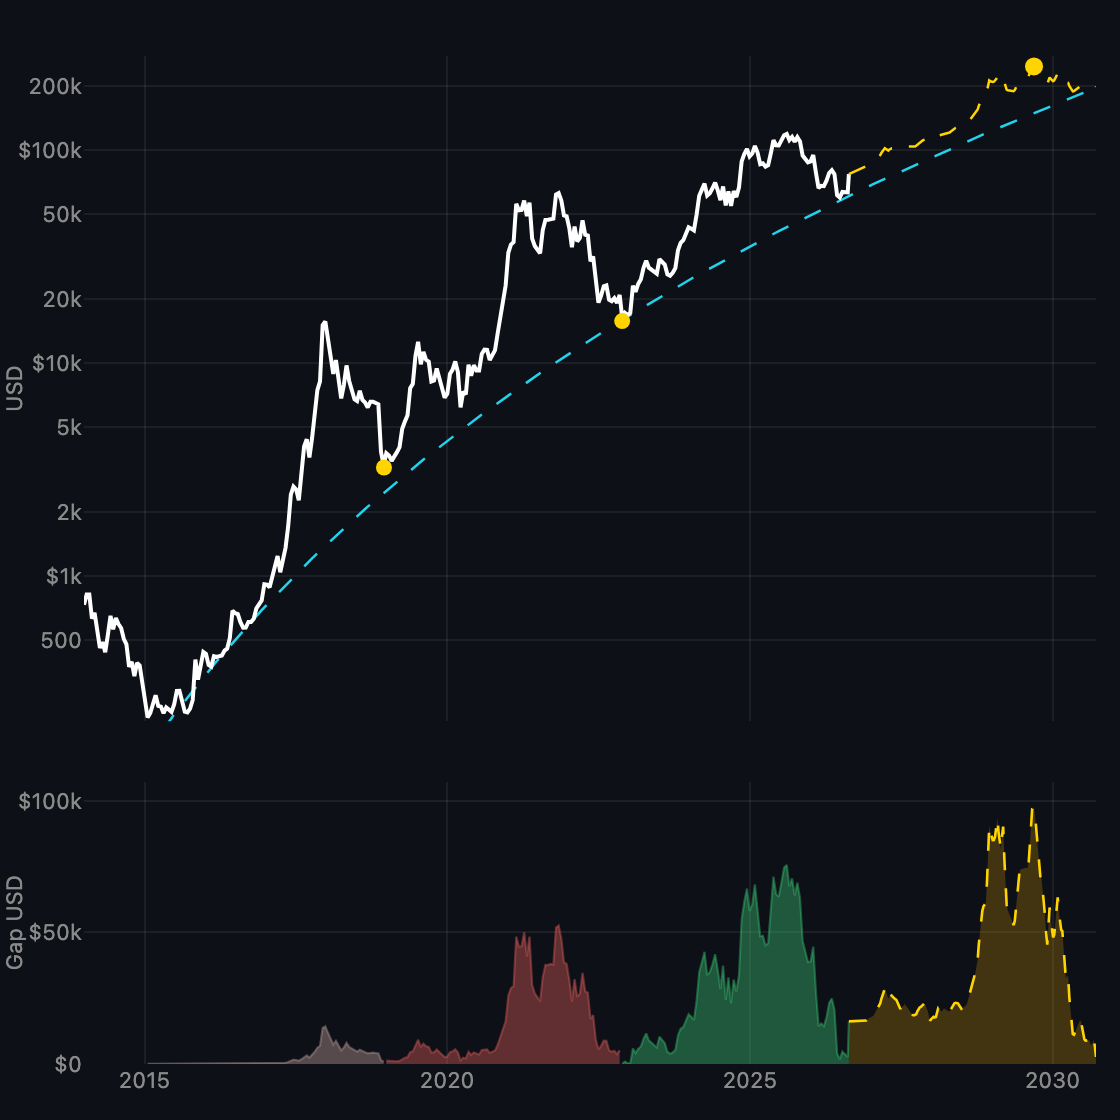
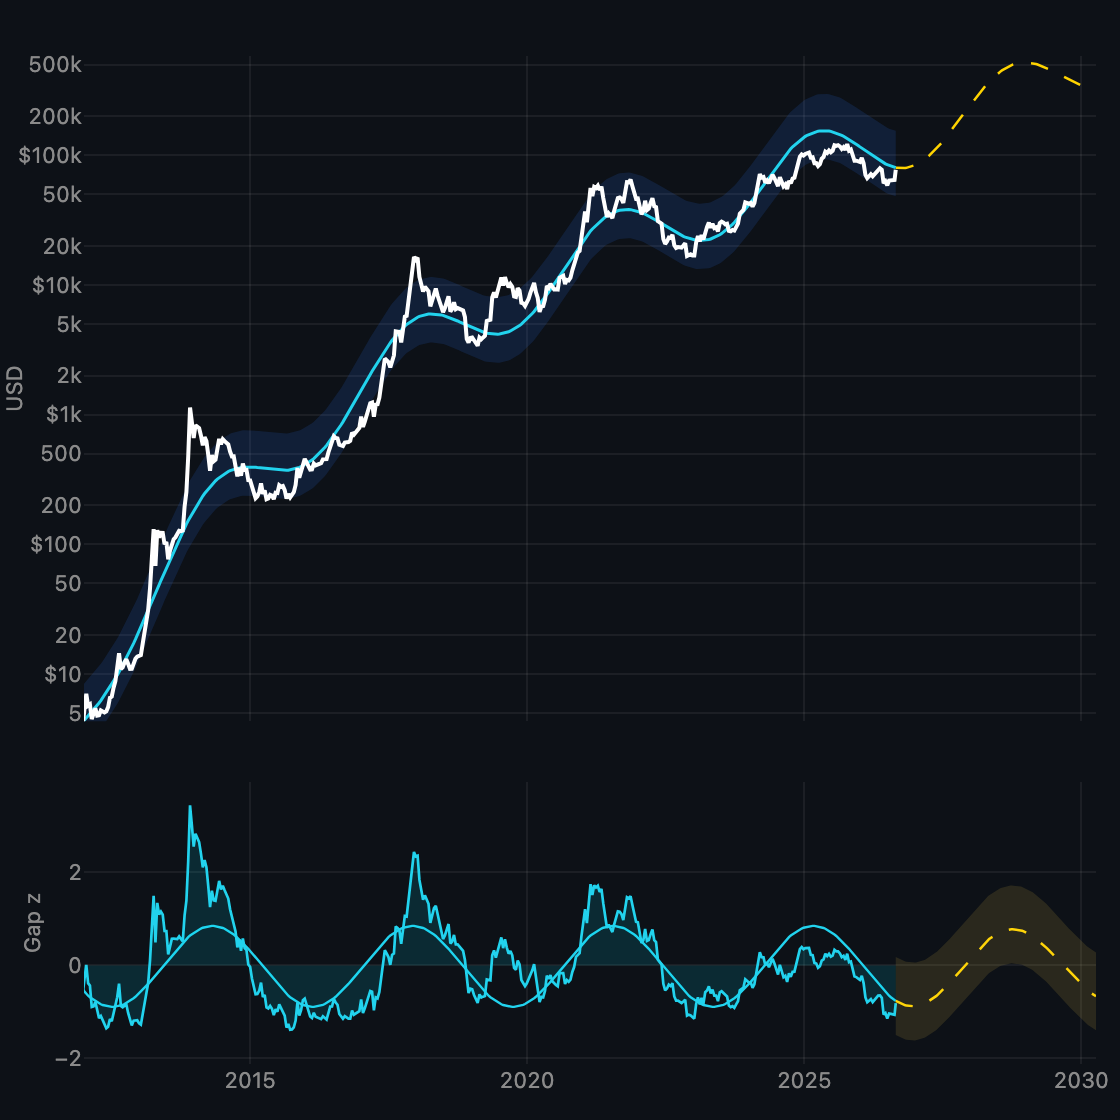
Gap above the power-law floor, cycle area, and predicted peak path.
-
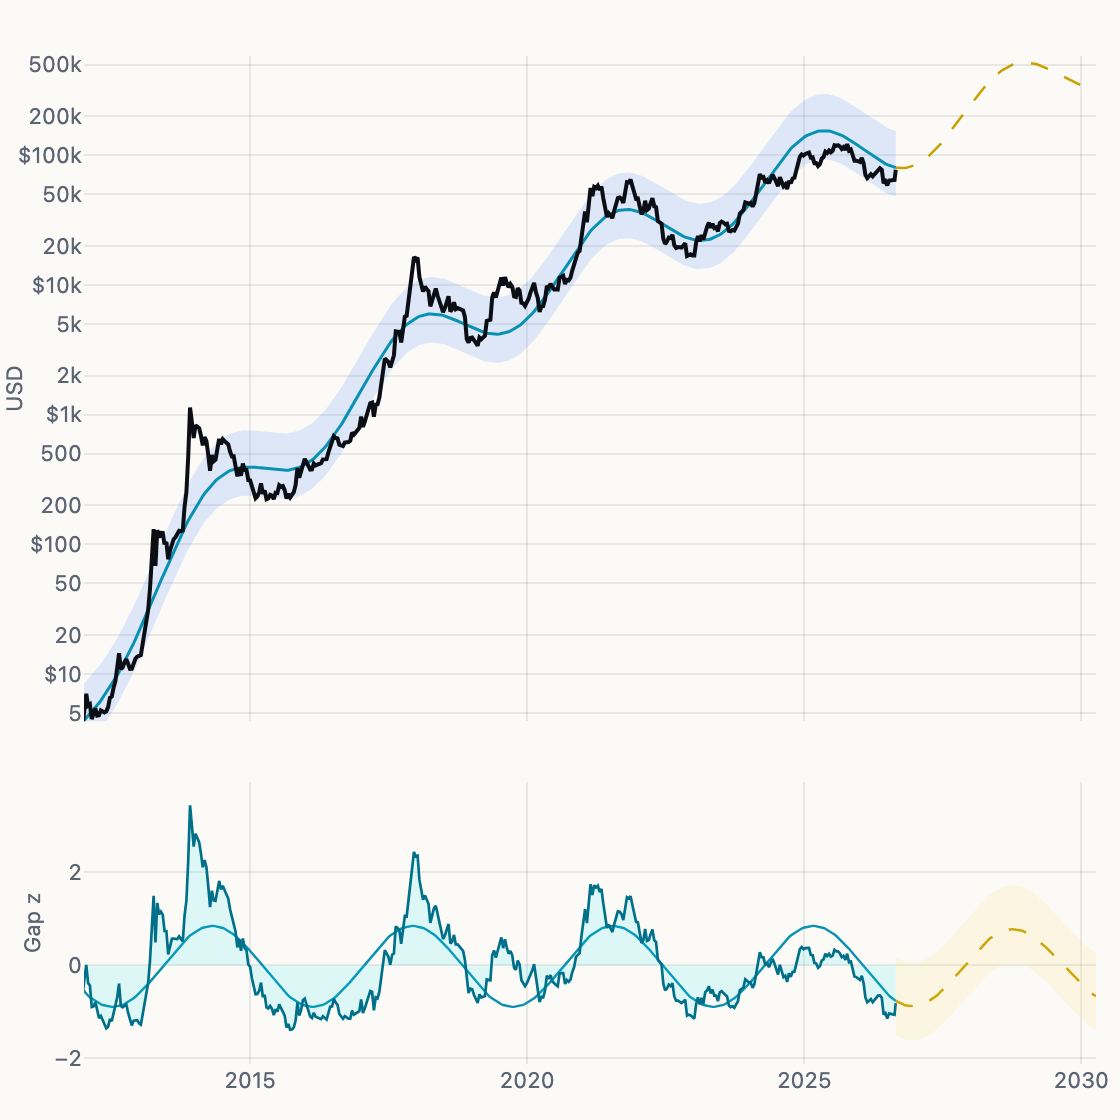
Harmonic Fair Value
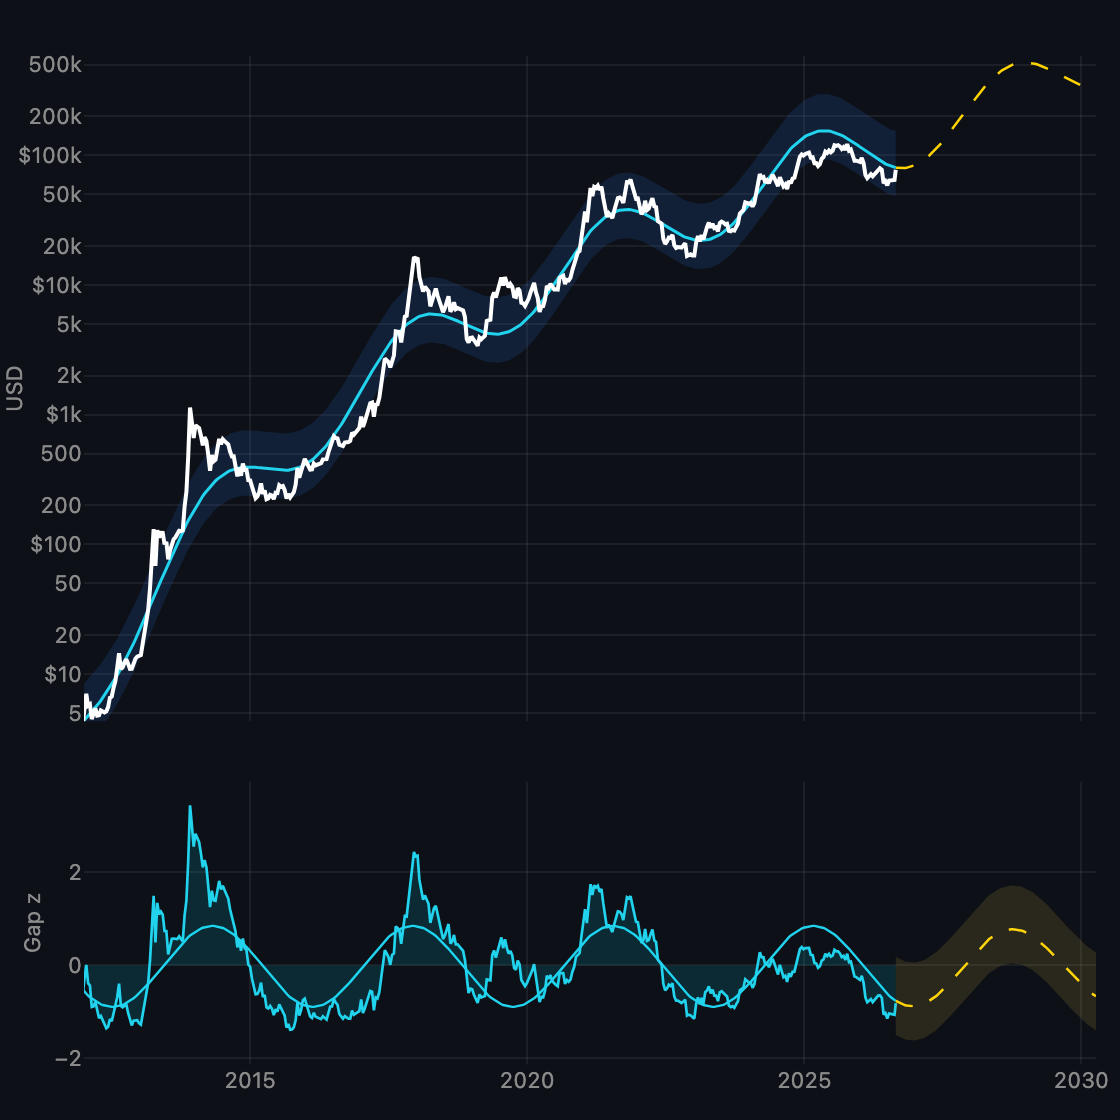
Sine-on-gap fair value around the power-law trend.
-
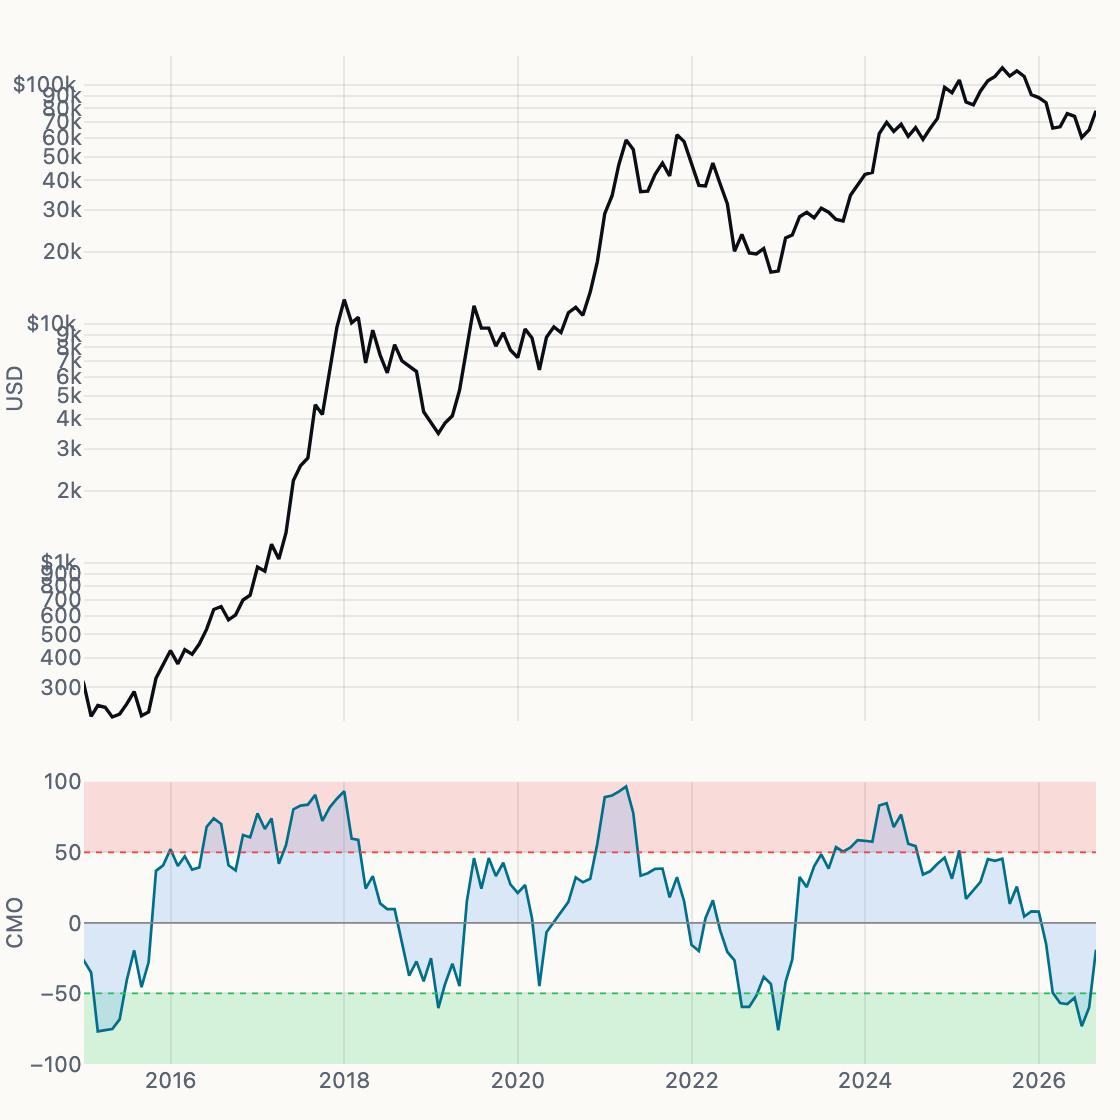
CMO 1M
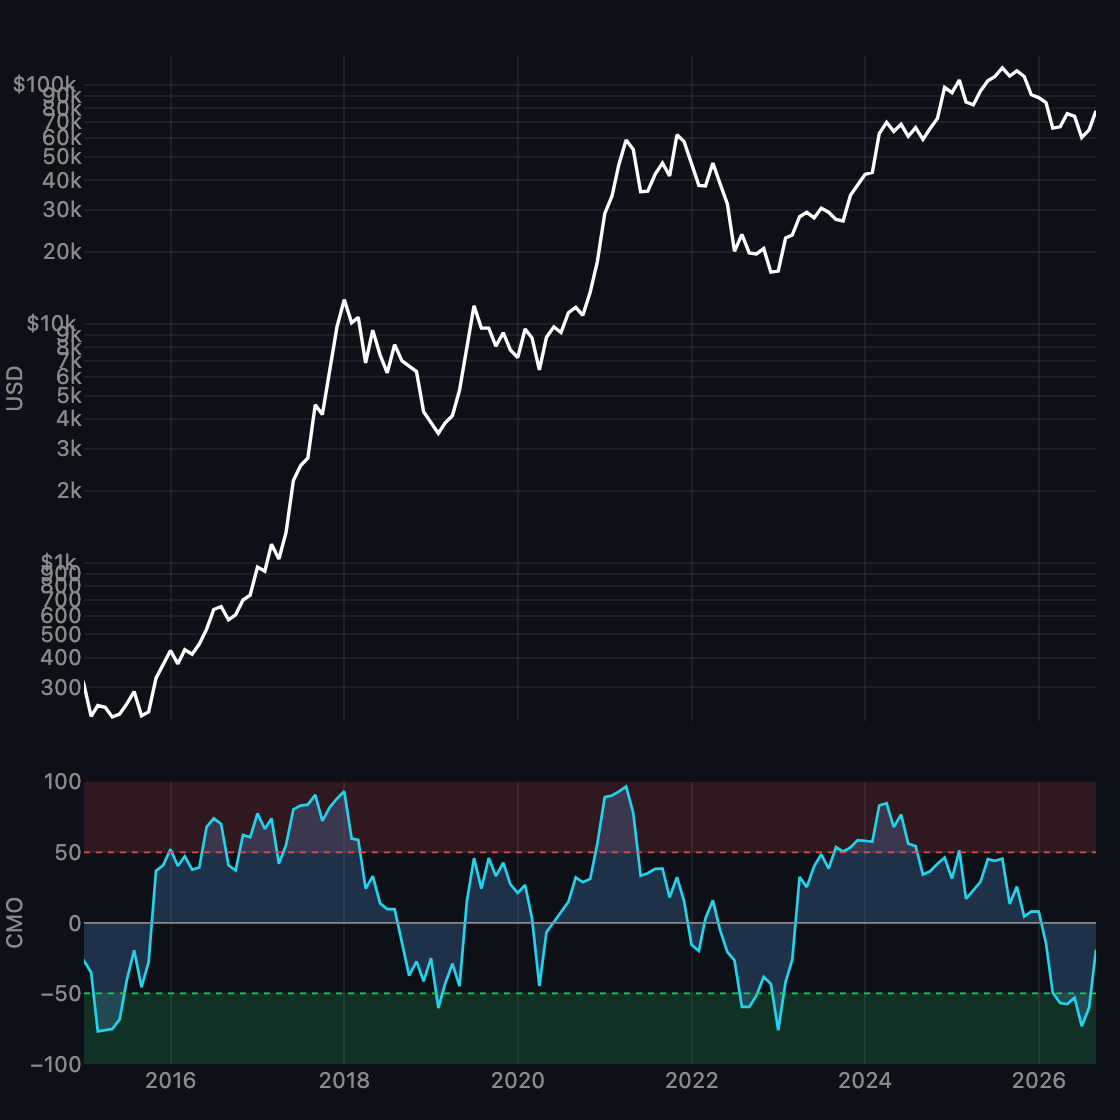
Monthly Chande Momentum with oversold / overbought bands.
-
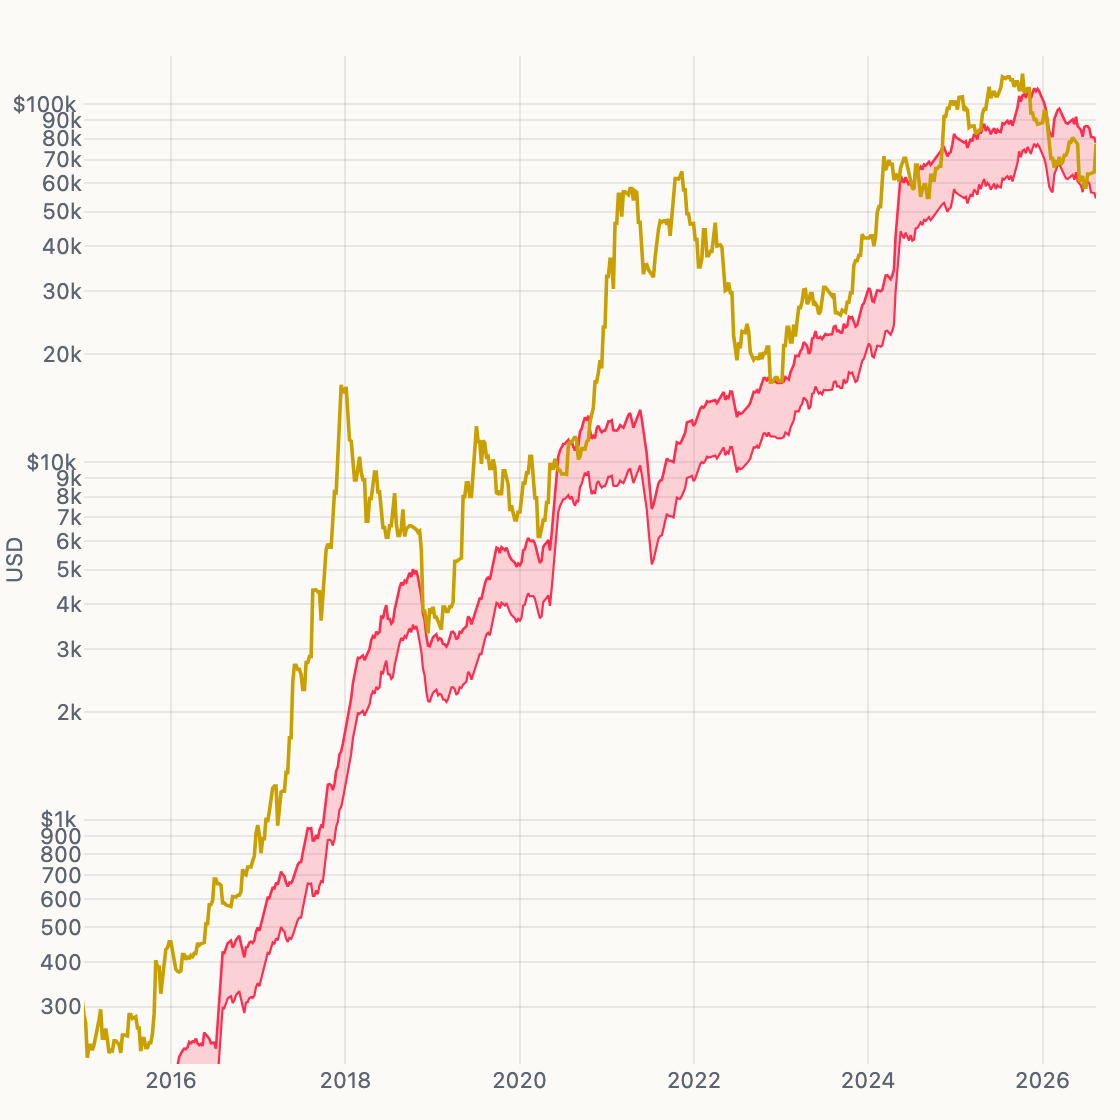
Production Cost
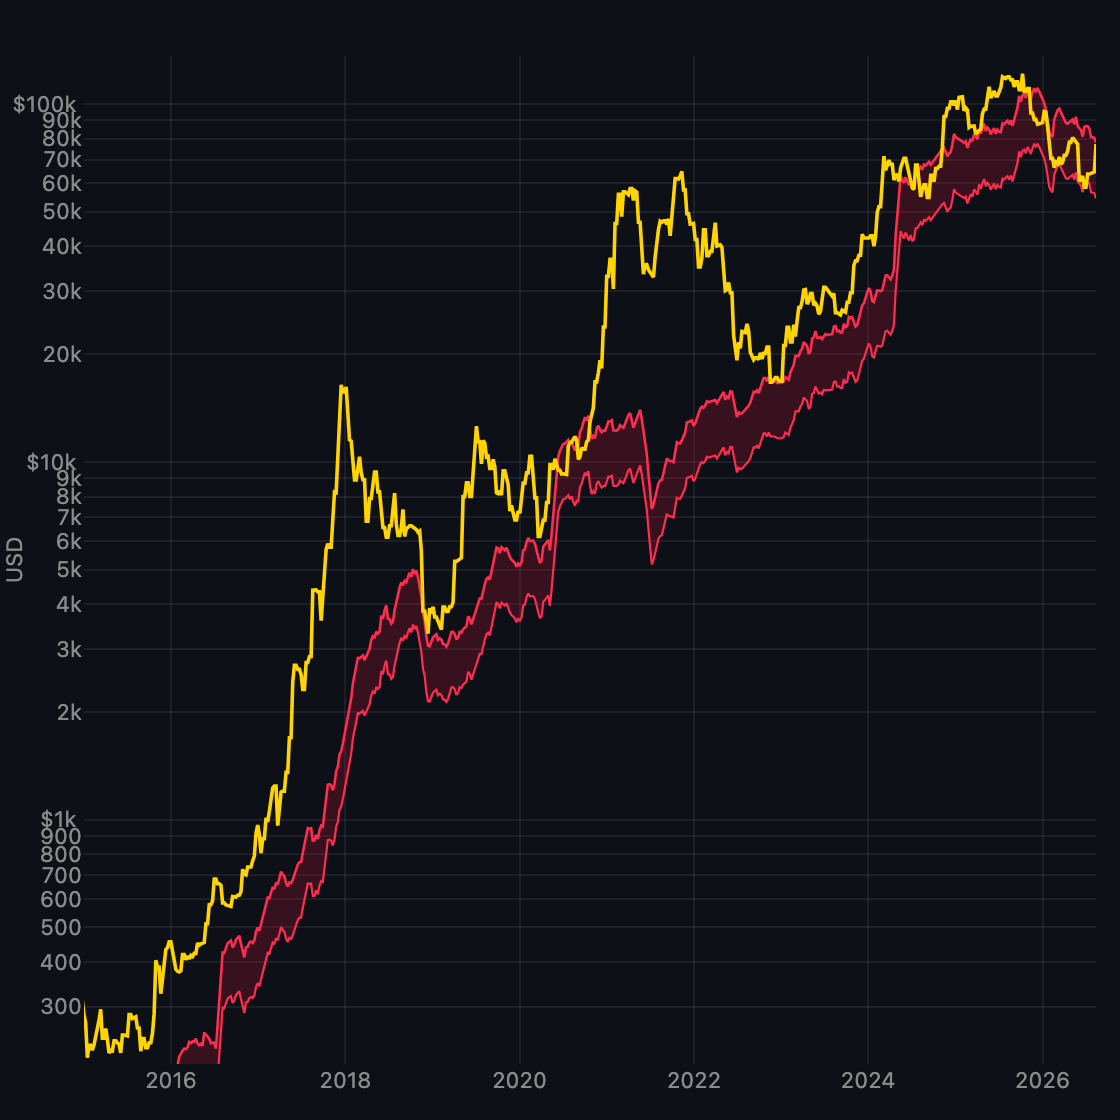
Spot vs miner electrical–all-in cost ribbon.
-
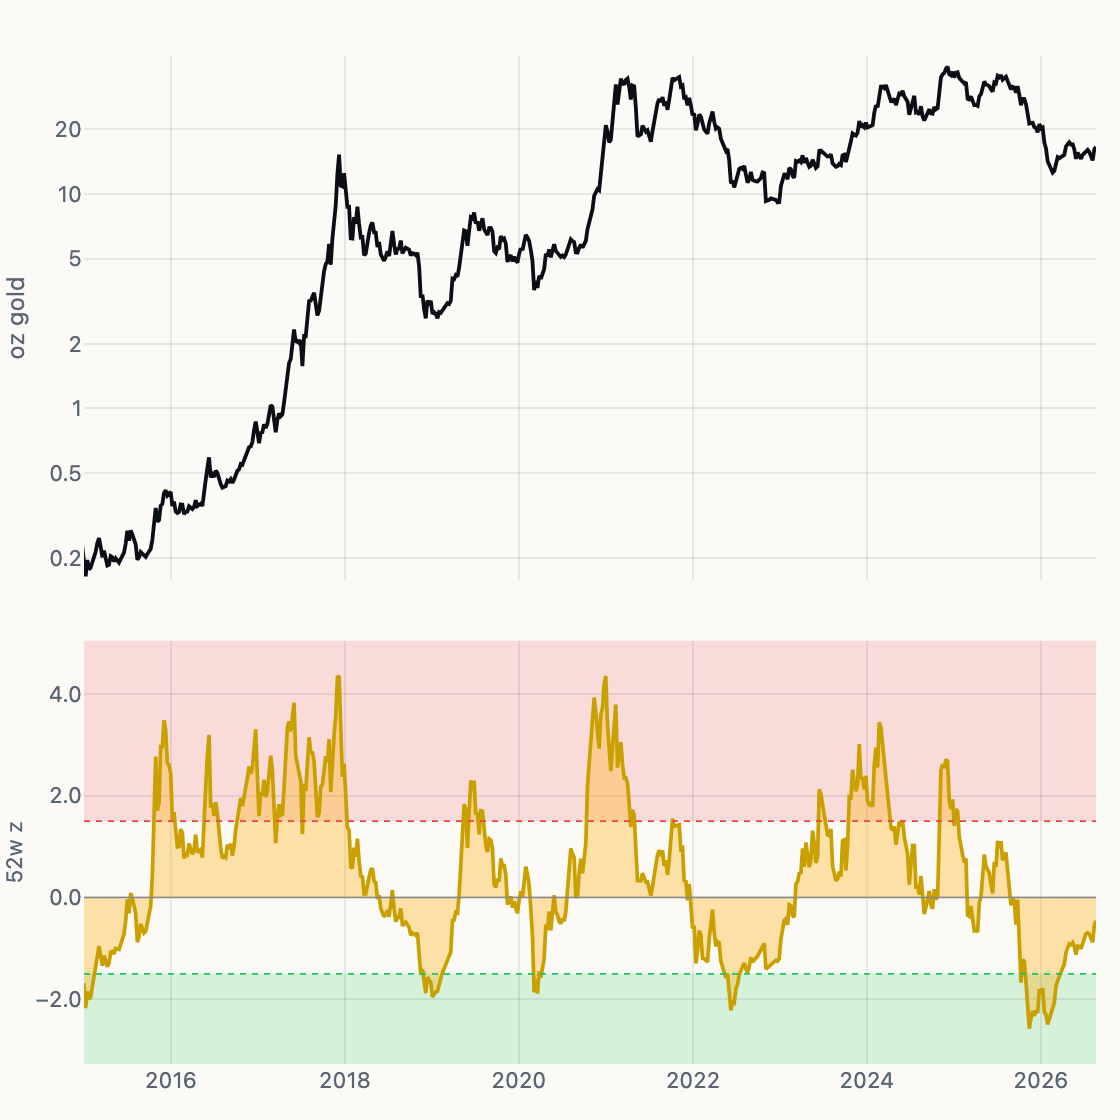
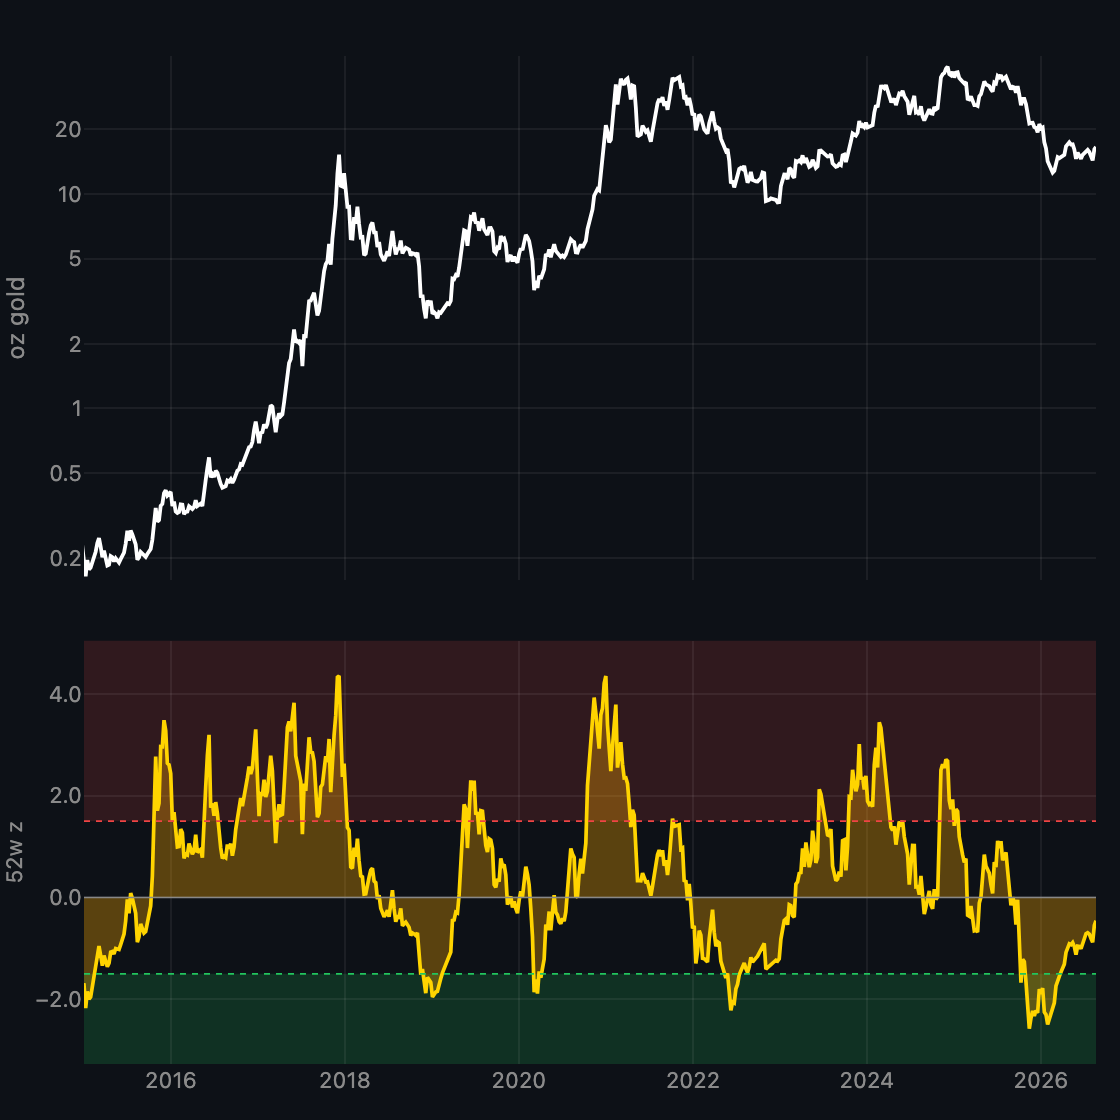
BTC / Gold
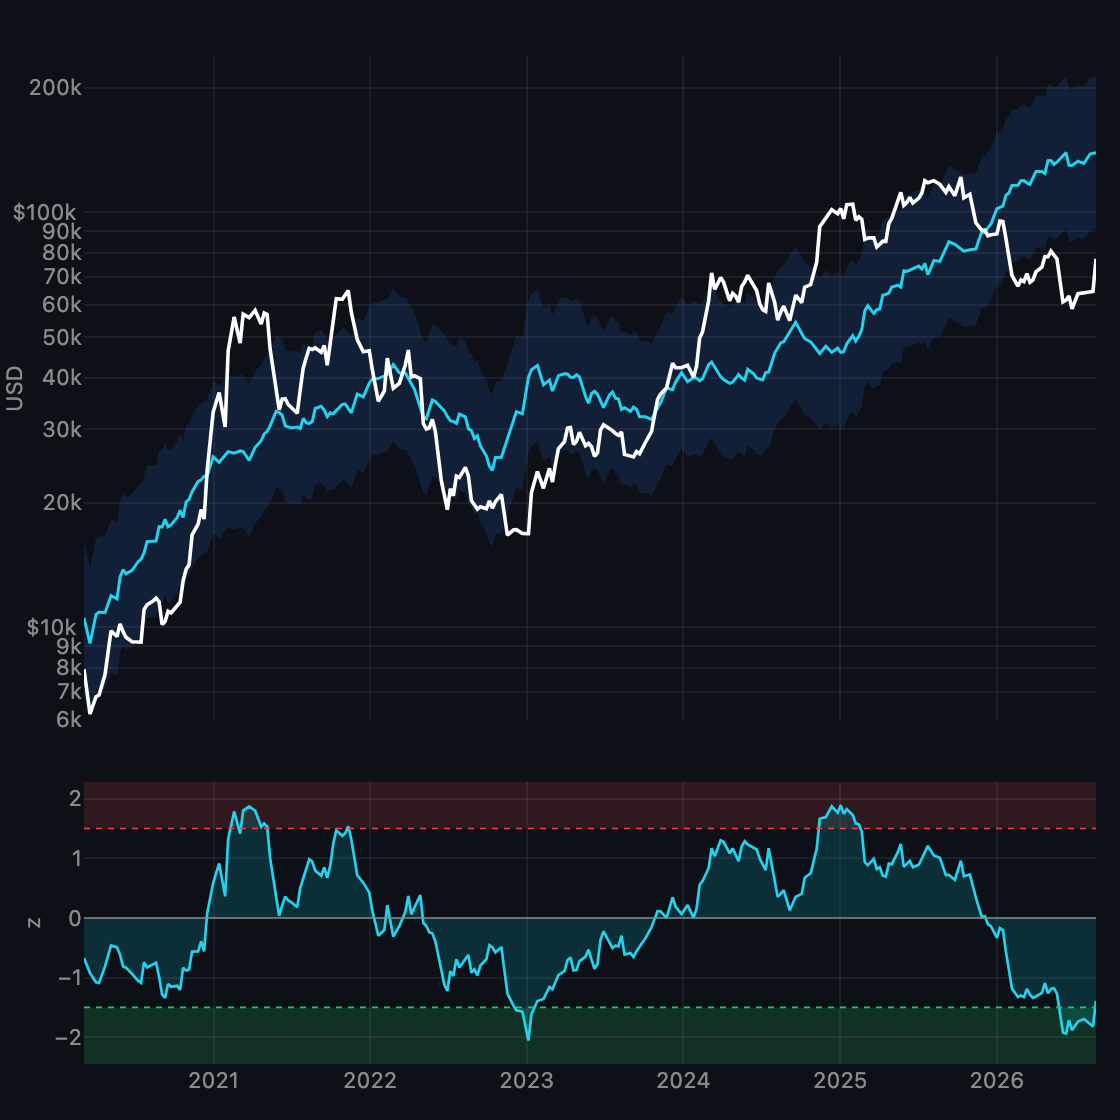
Weekly BTC priced in gold, with a 52-week z-score of the ratio.
-
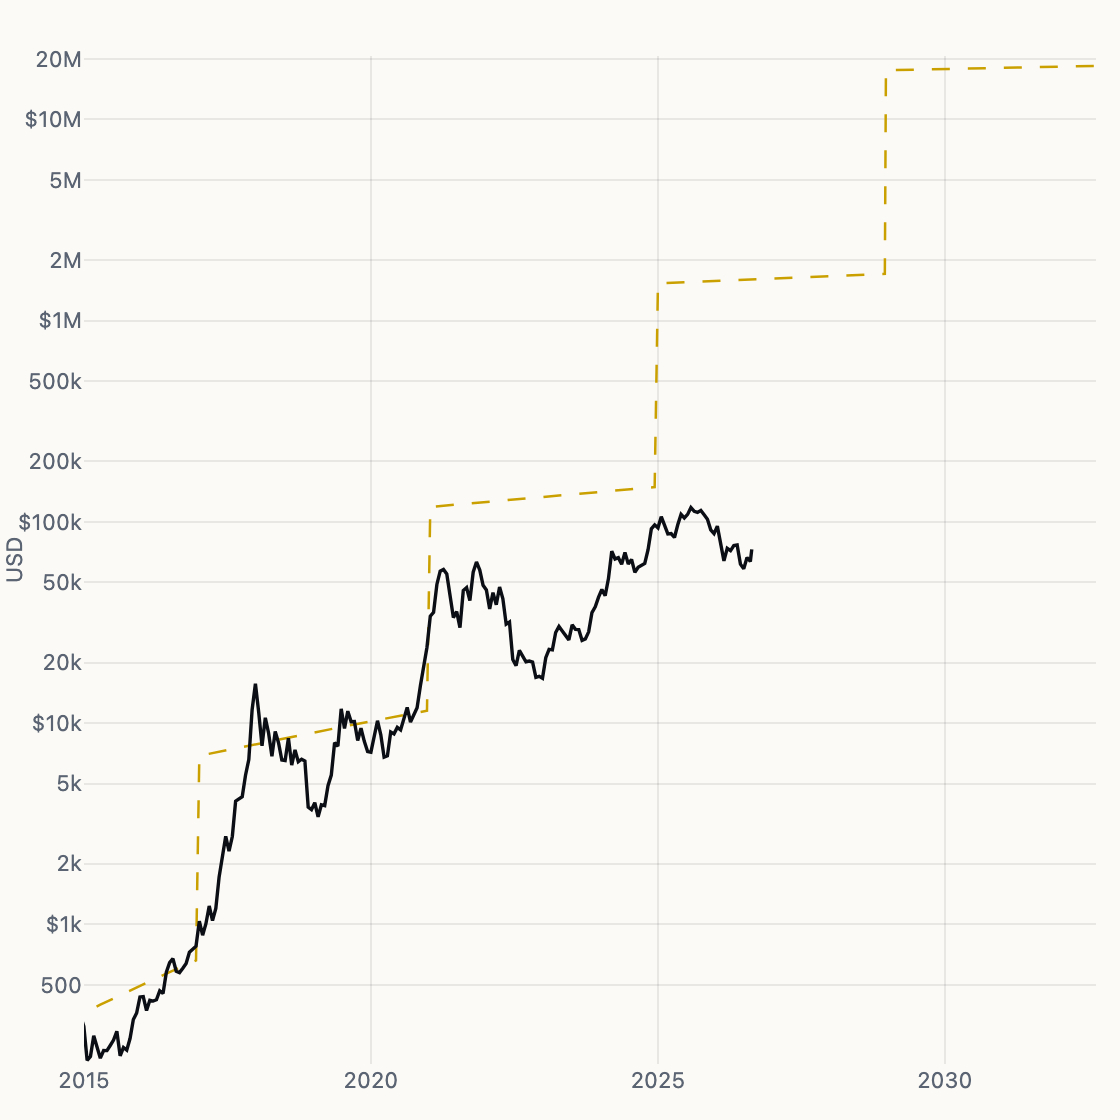
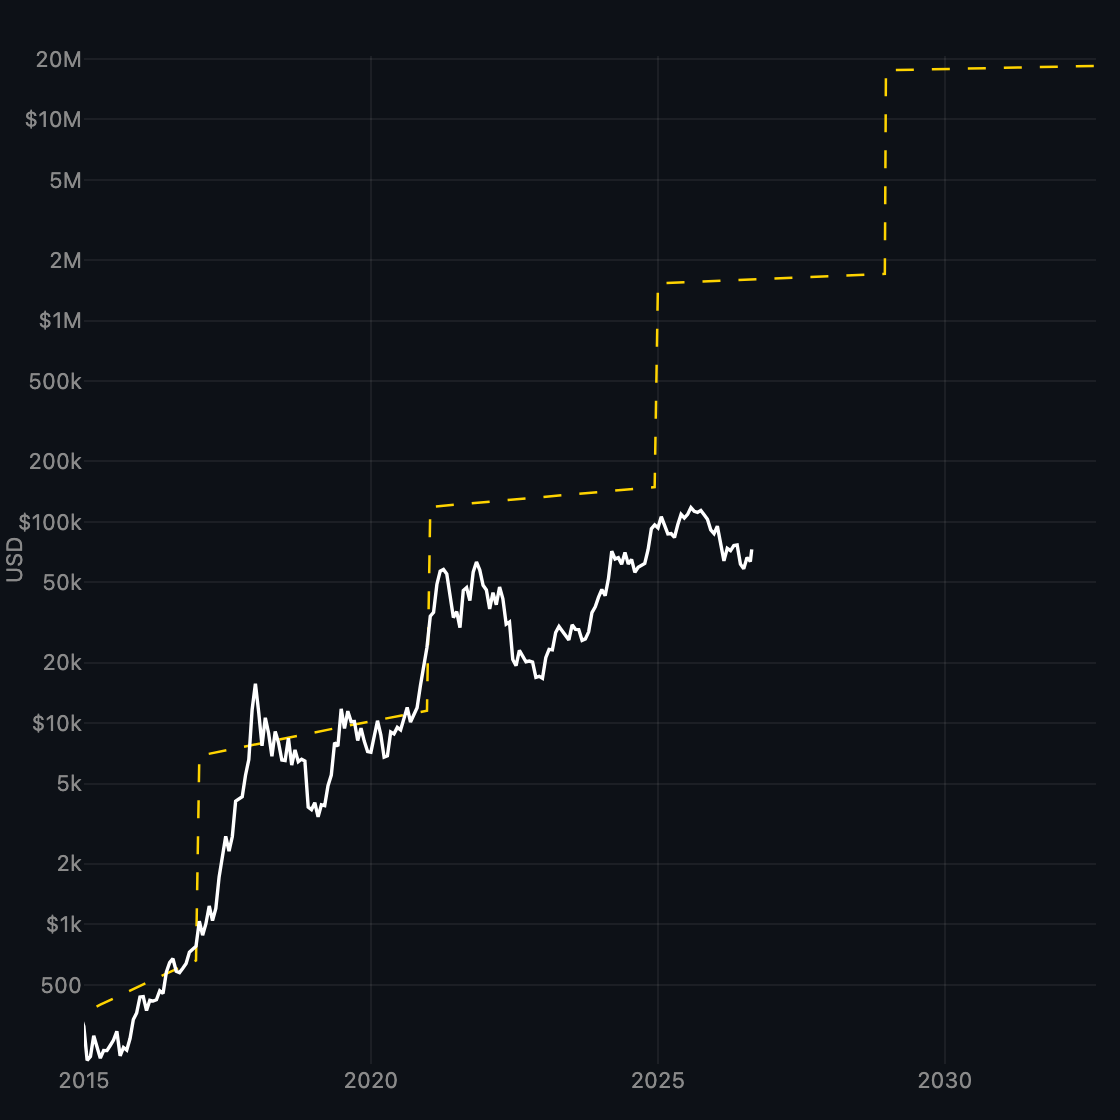
Stock-to-Flow
PlanB-style S2F model vs spot.
-
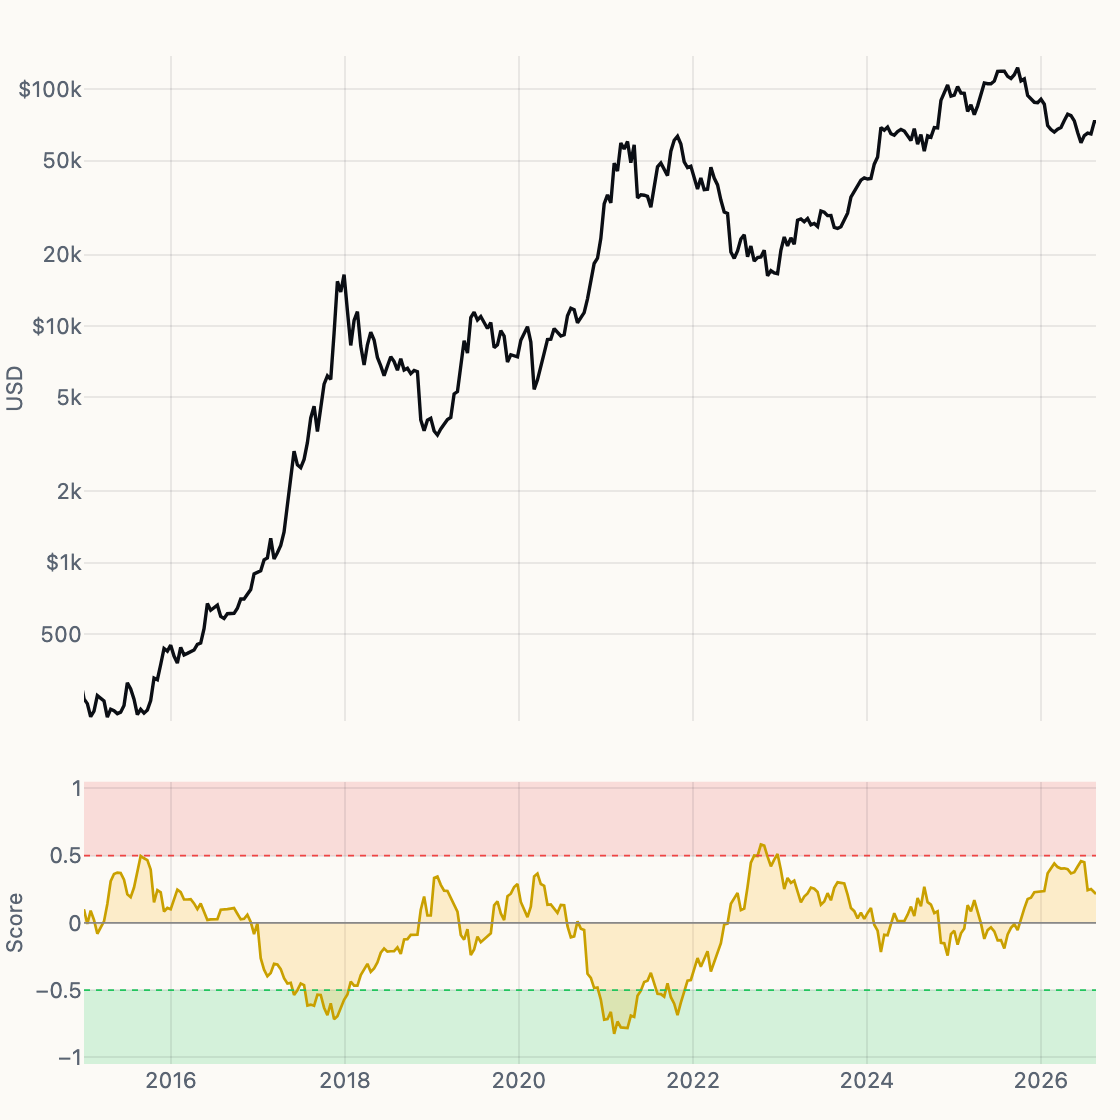
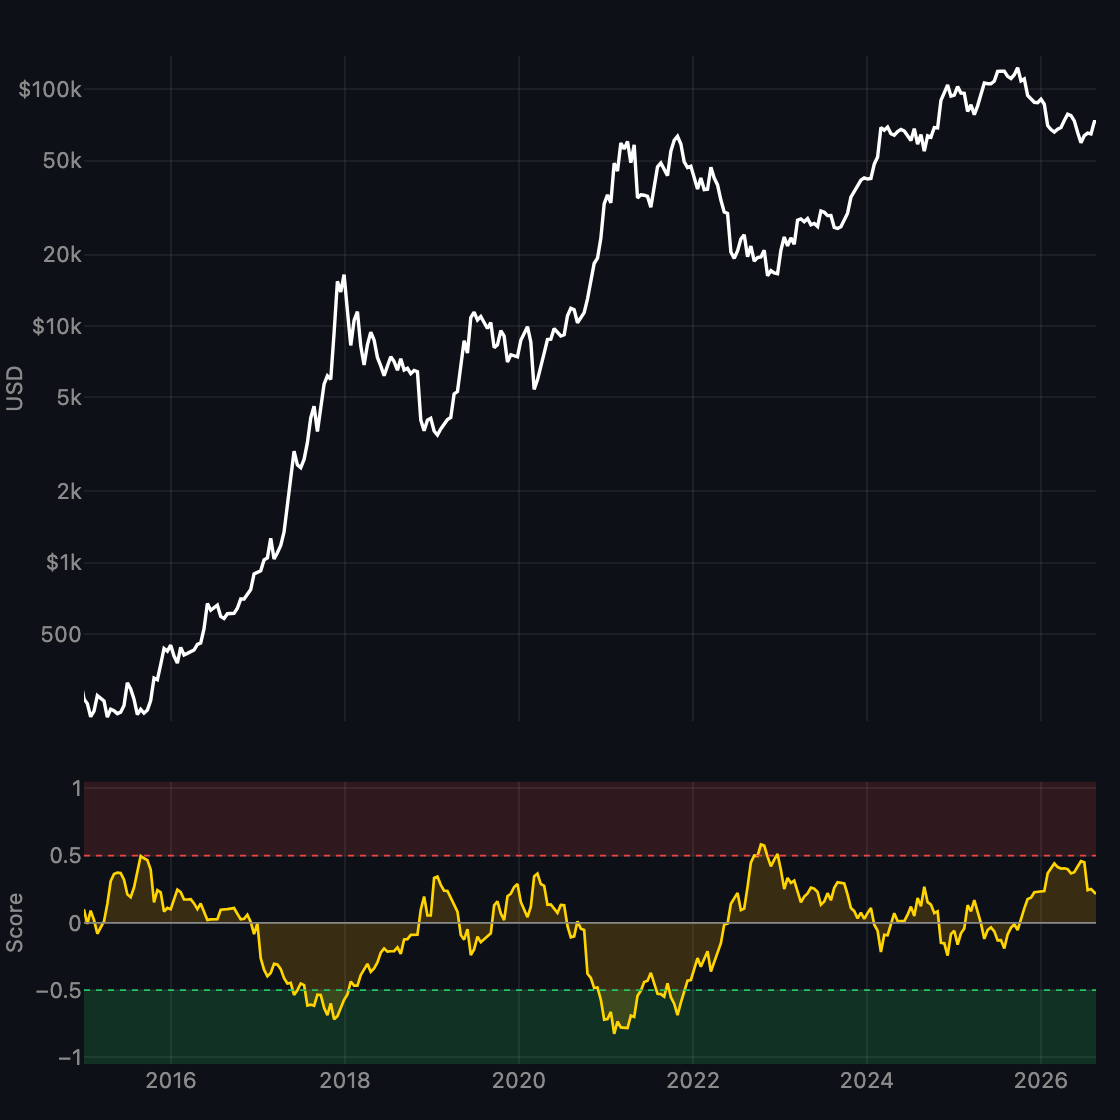
Cycle Score
Composite −1…+1 cycle score with vote chips.
-
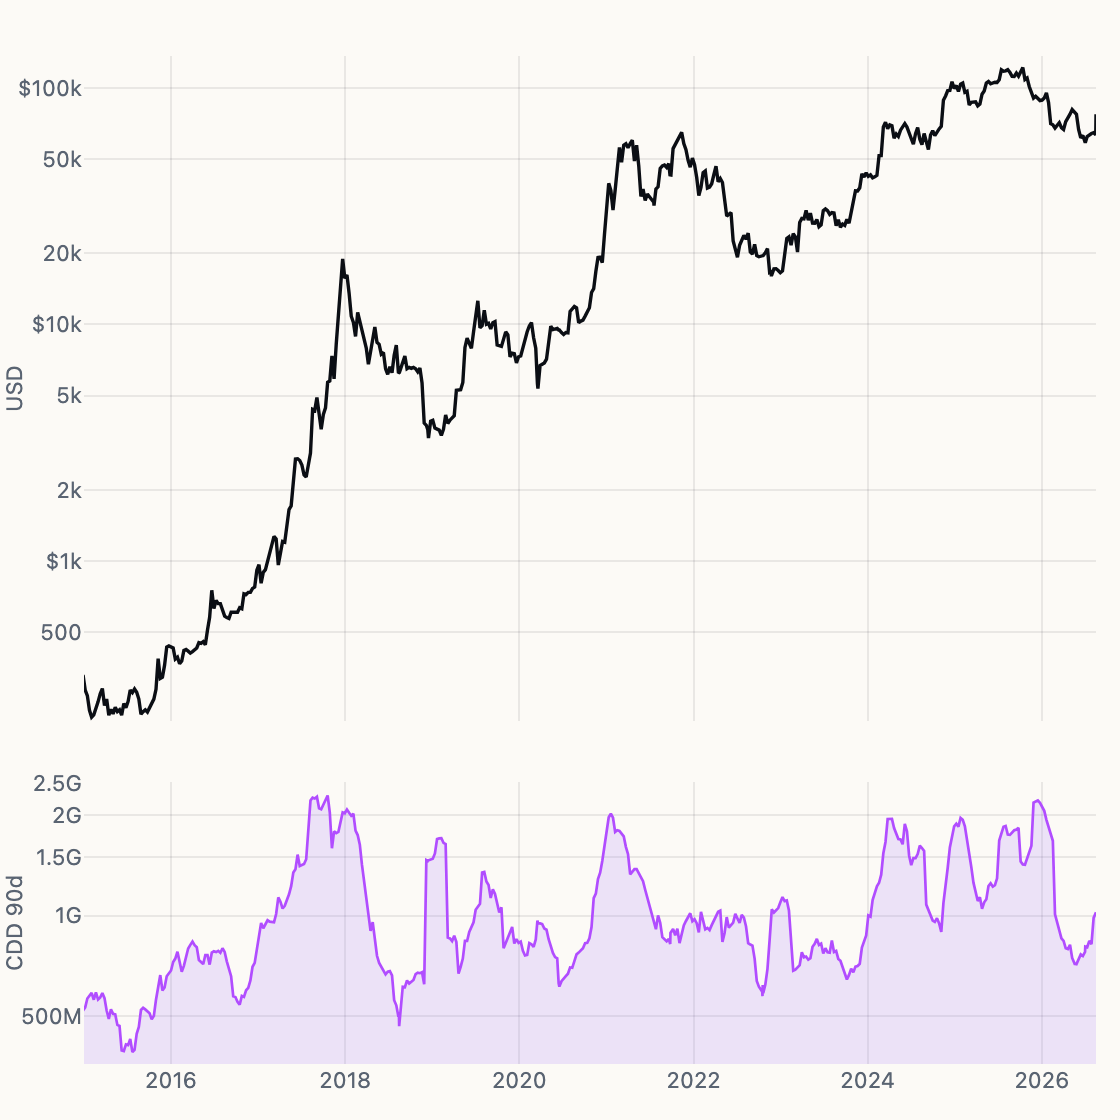
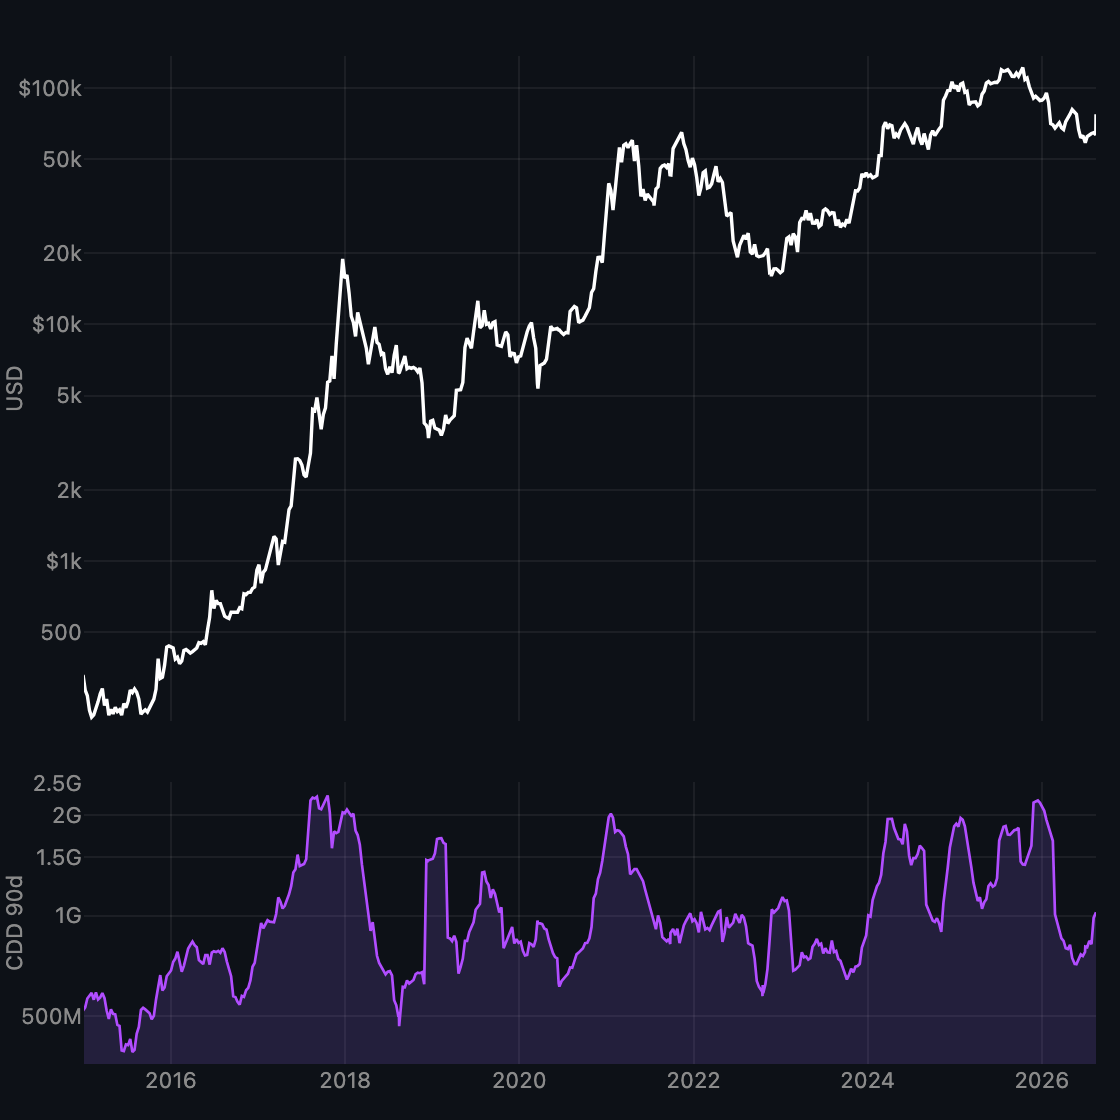
CDD 90D
Spot vs 90-day coin-days destroyed.
-
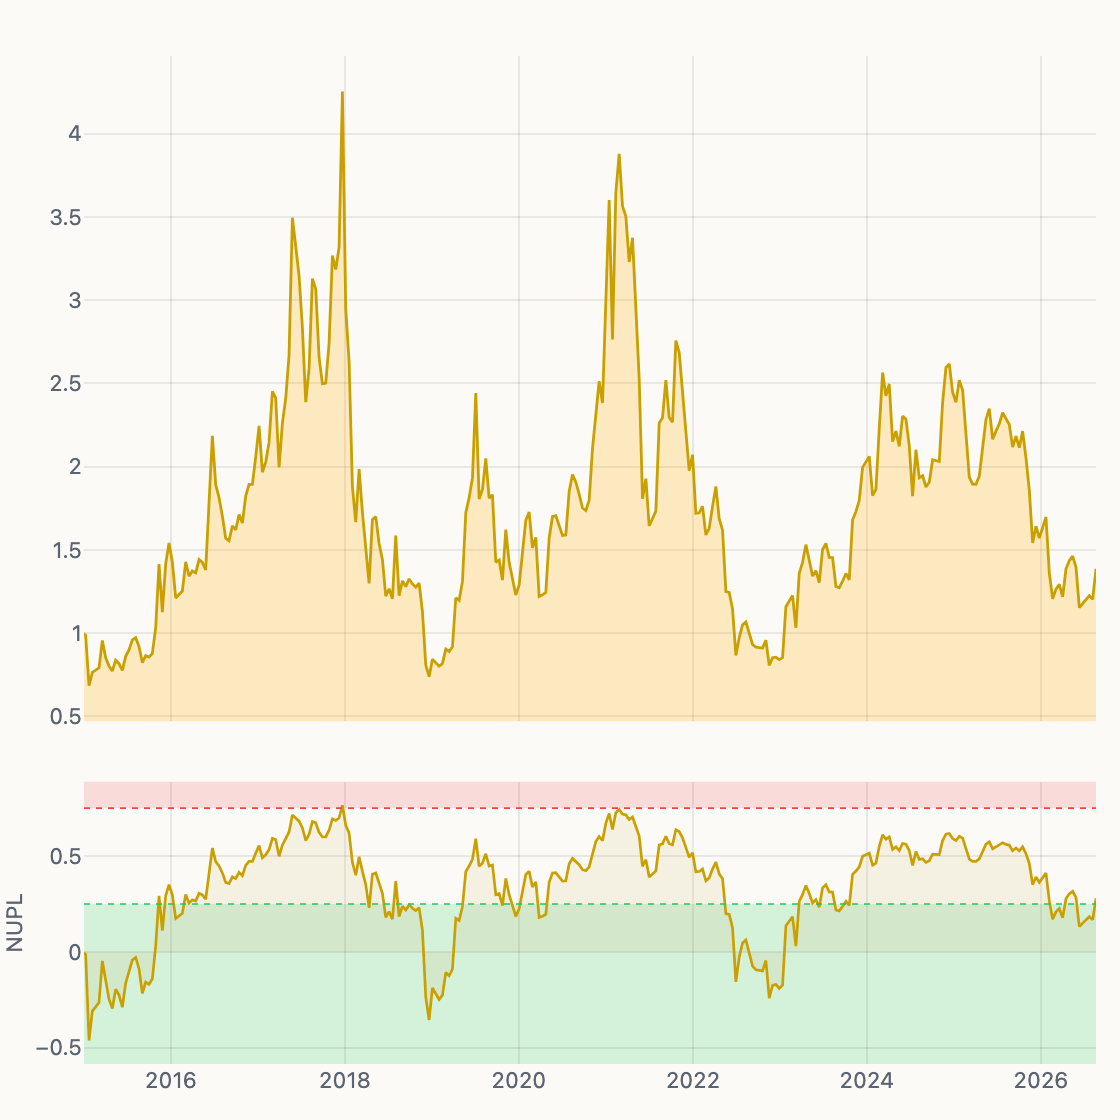
MVRV / NUPL
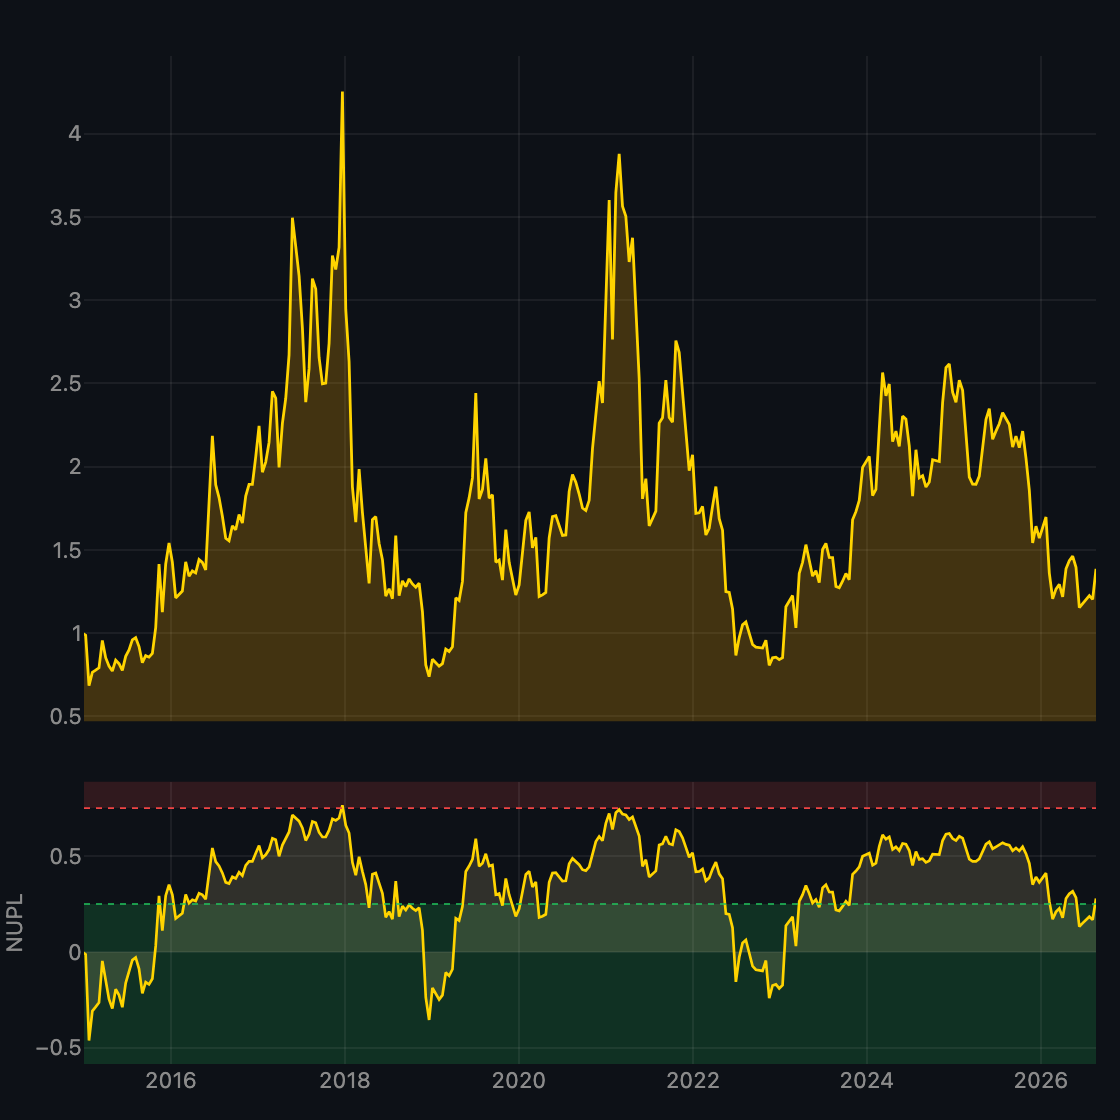
Dual MVRV and NUPL valuation oscillators.
-
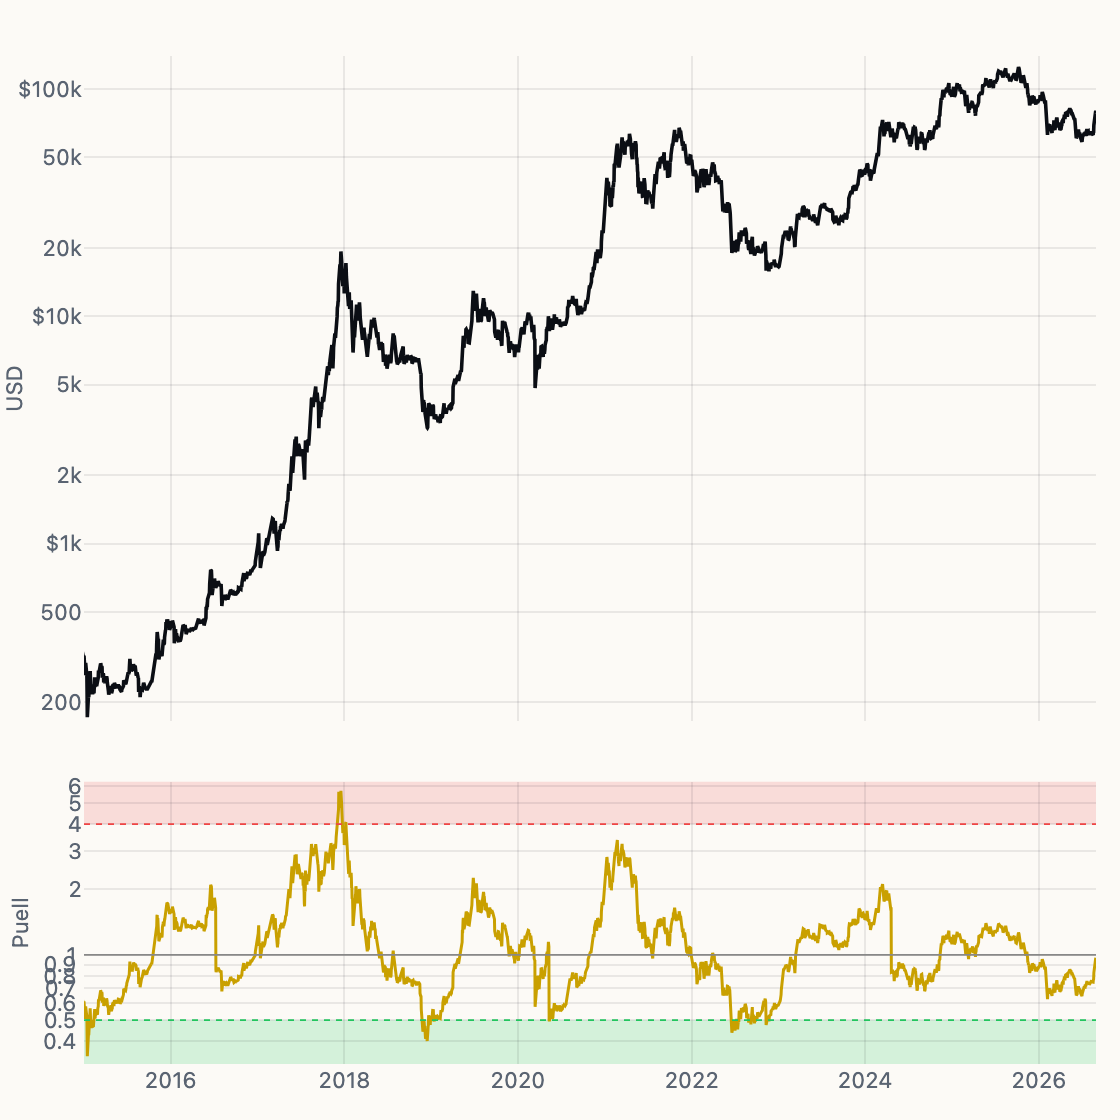
Puell Multiple
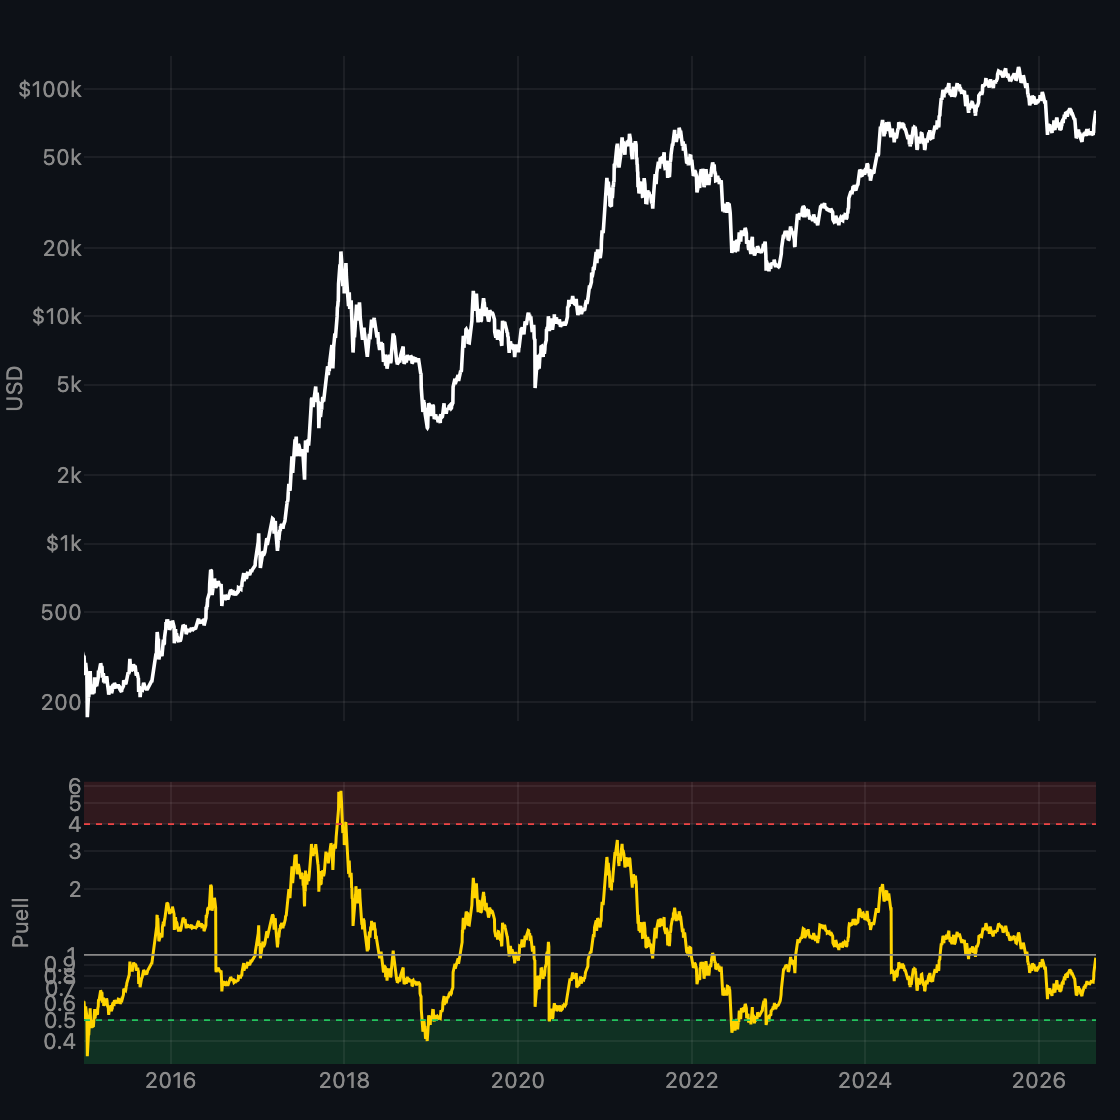
Miner revenue vs 365-day average.
-
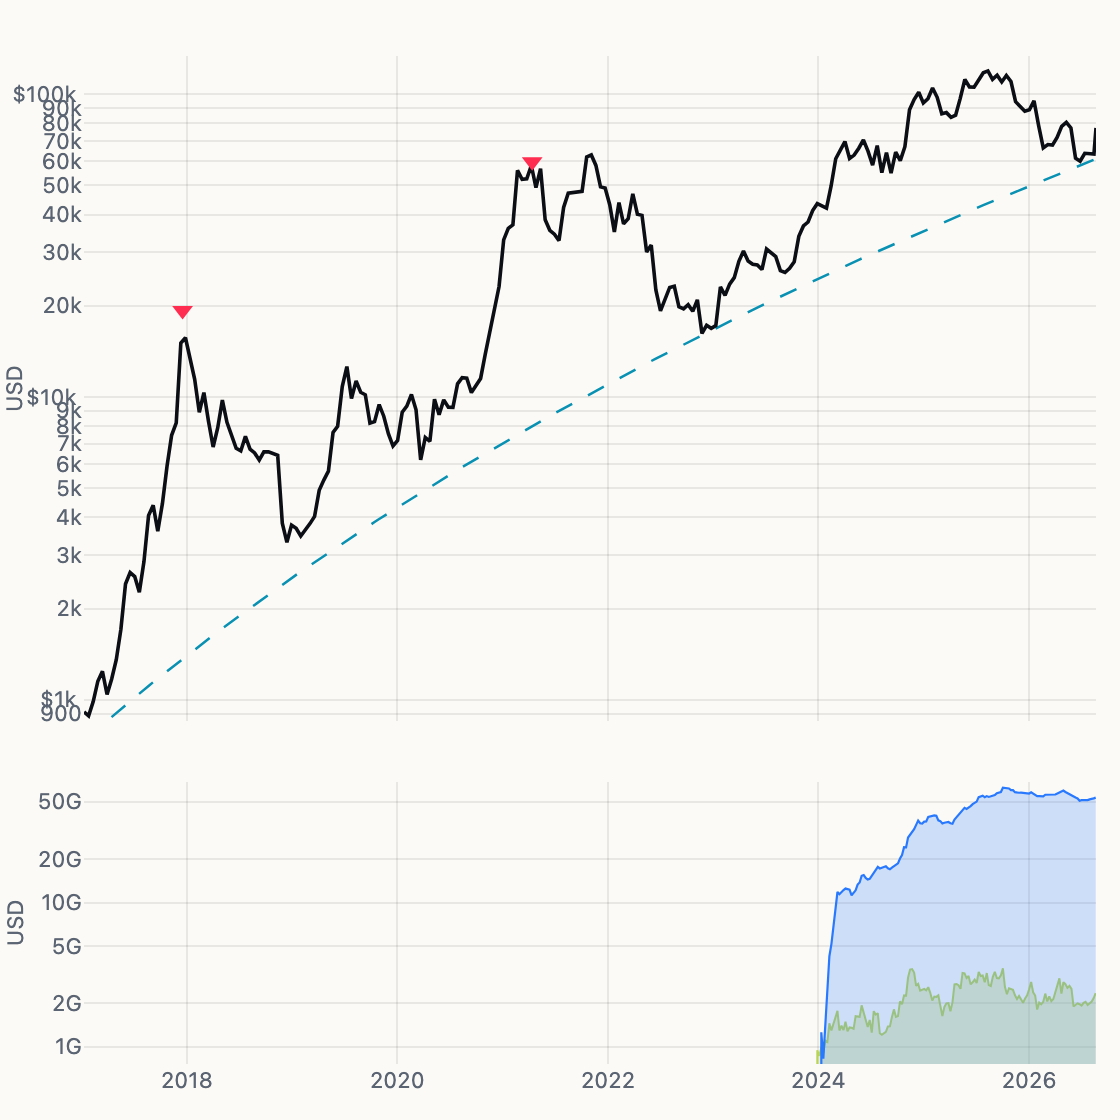
ETF Flows / OI
Spot with ETF cumulative net and perp open interest.
-
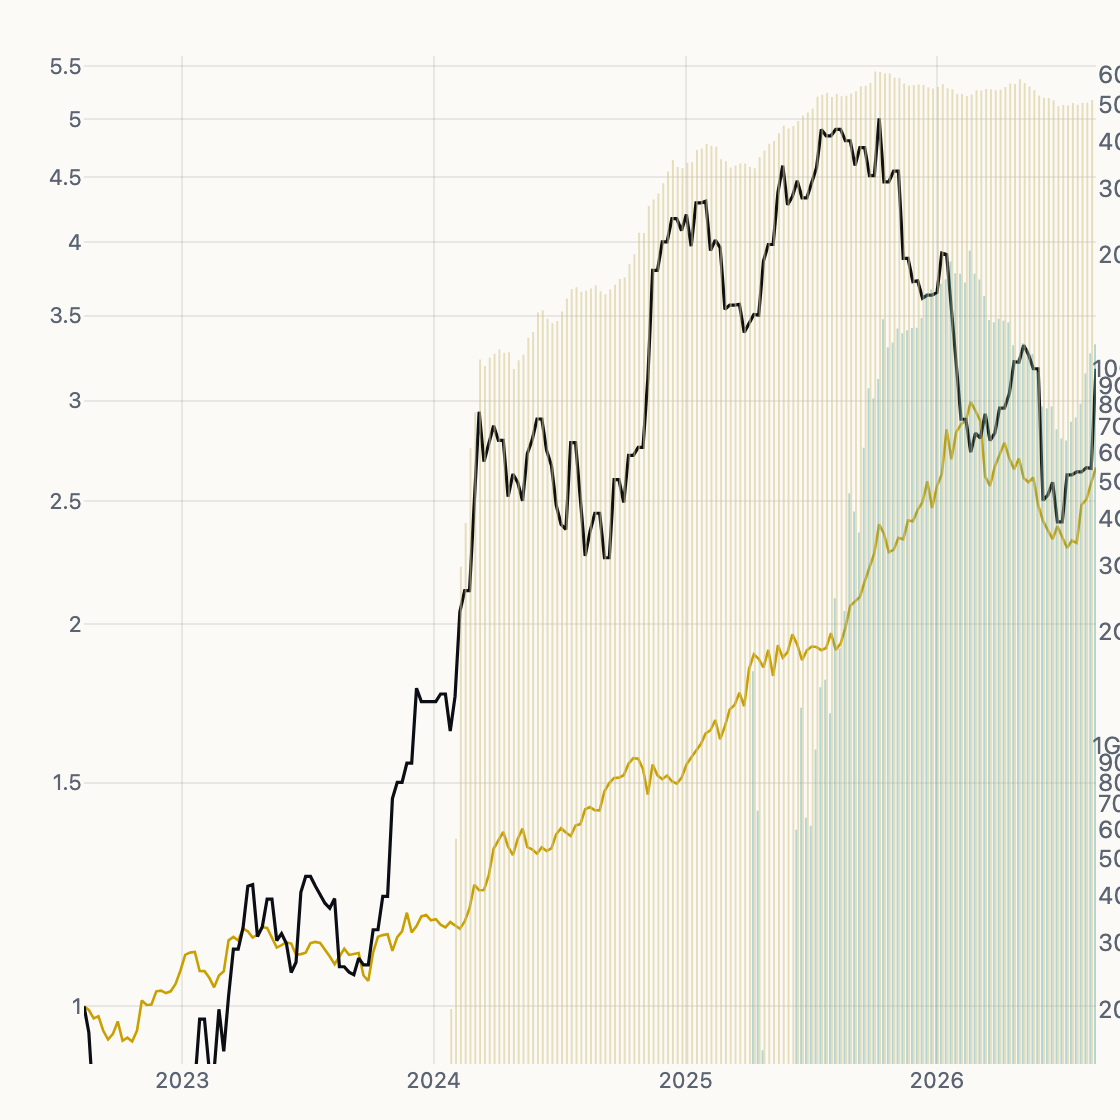
Gold & Bitcoin ETP Flows
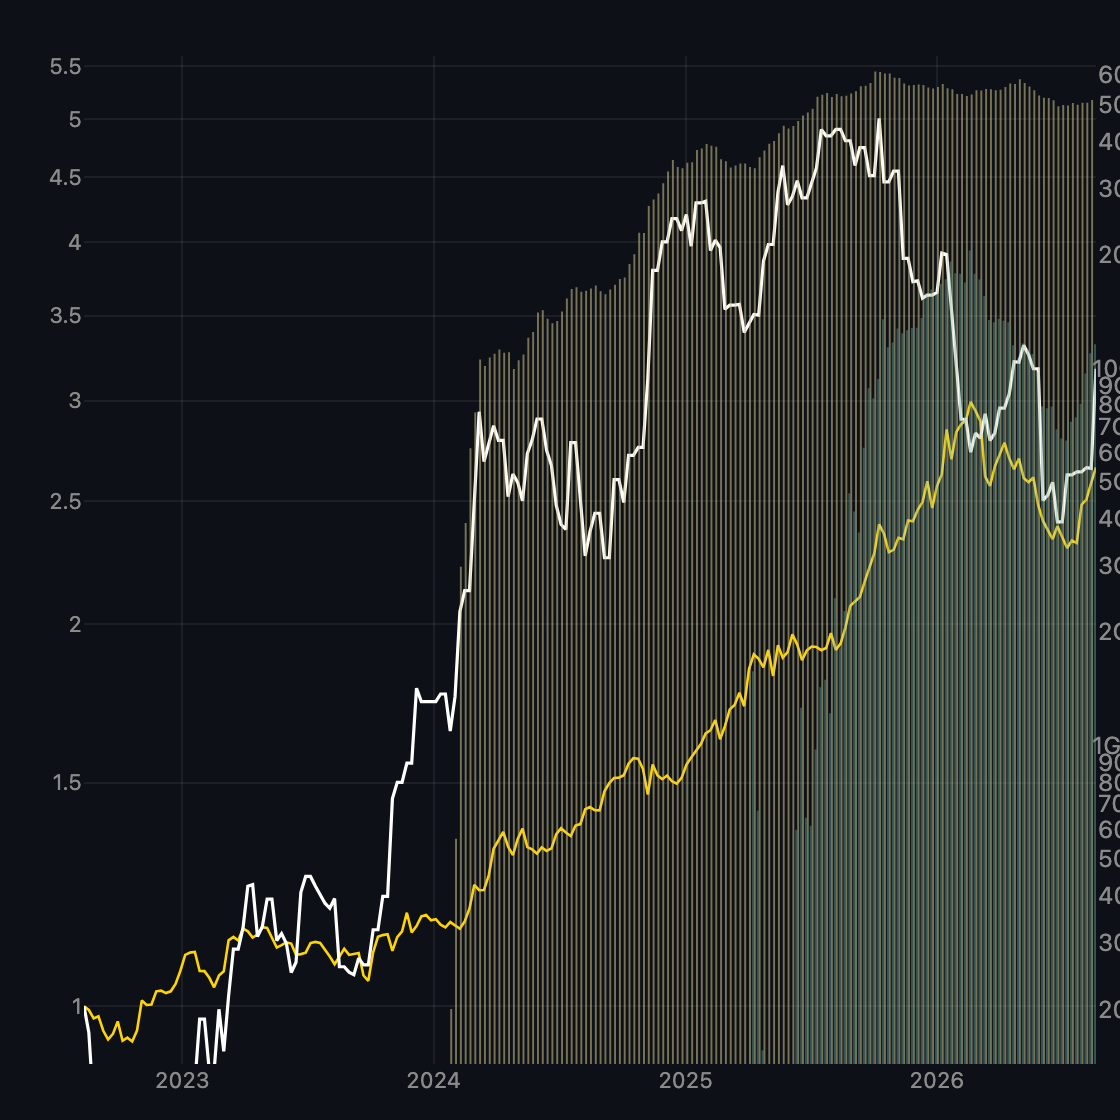
Indexed returns and GLD + BTC ETF cumulative flows.
-
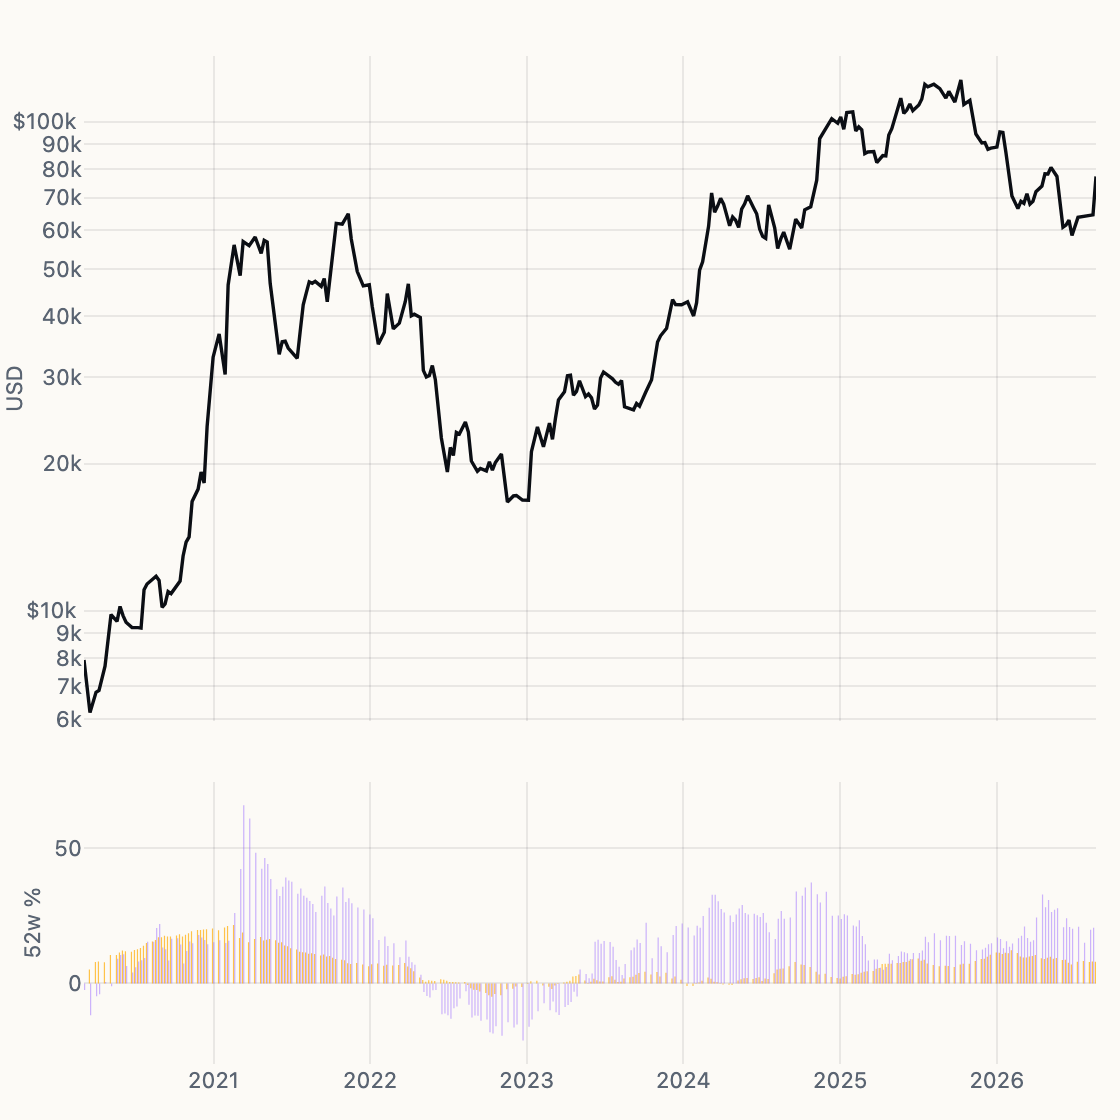
Bitcoin & Liquidity
BTC vs G4 M2 and SPX 52-week context.
-
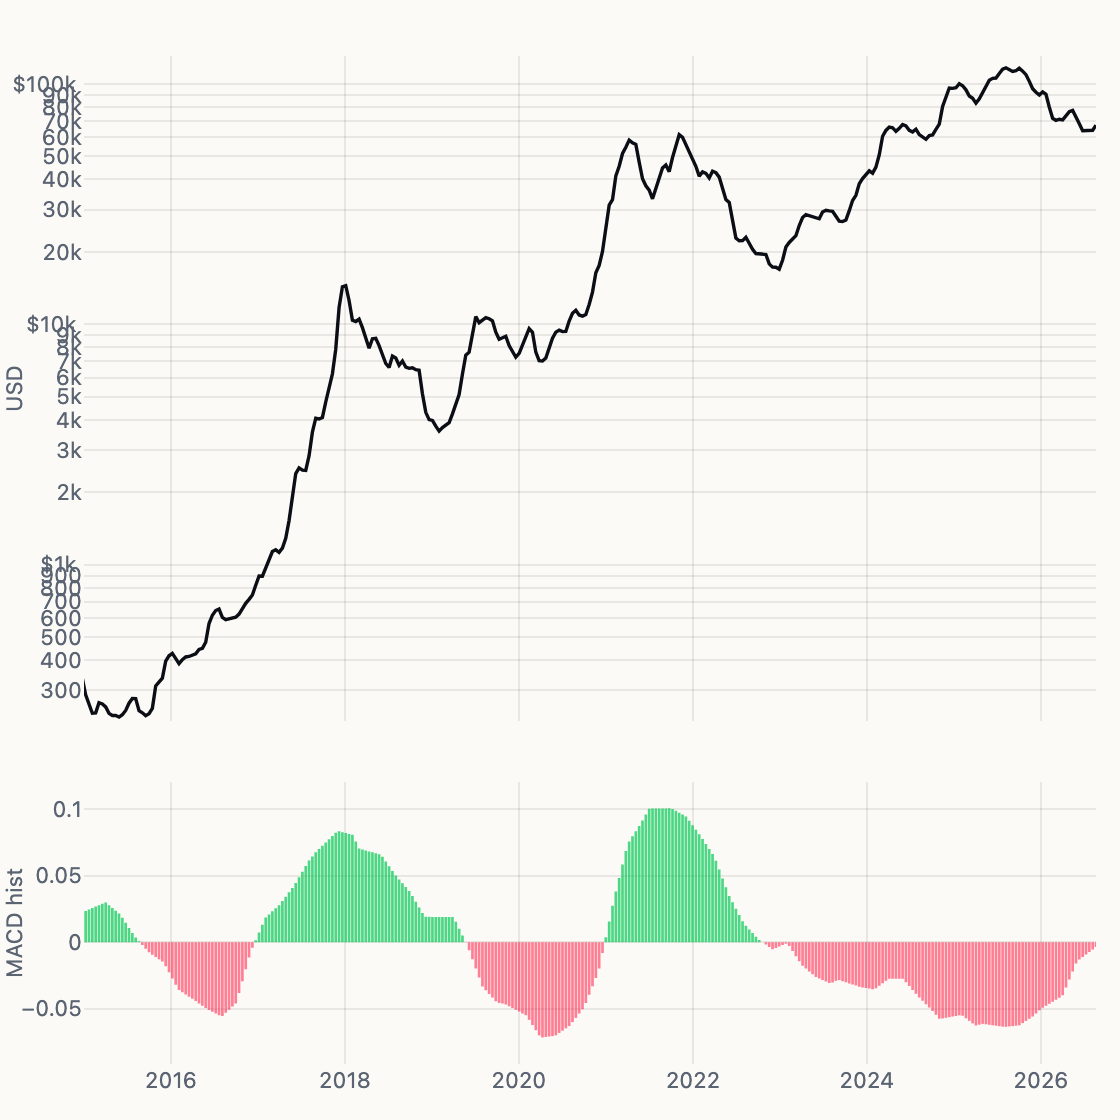
Cu/Au MACD
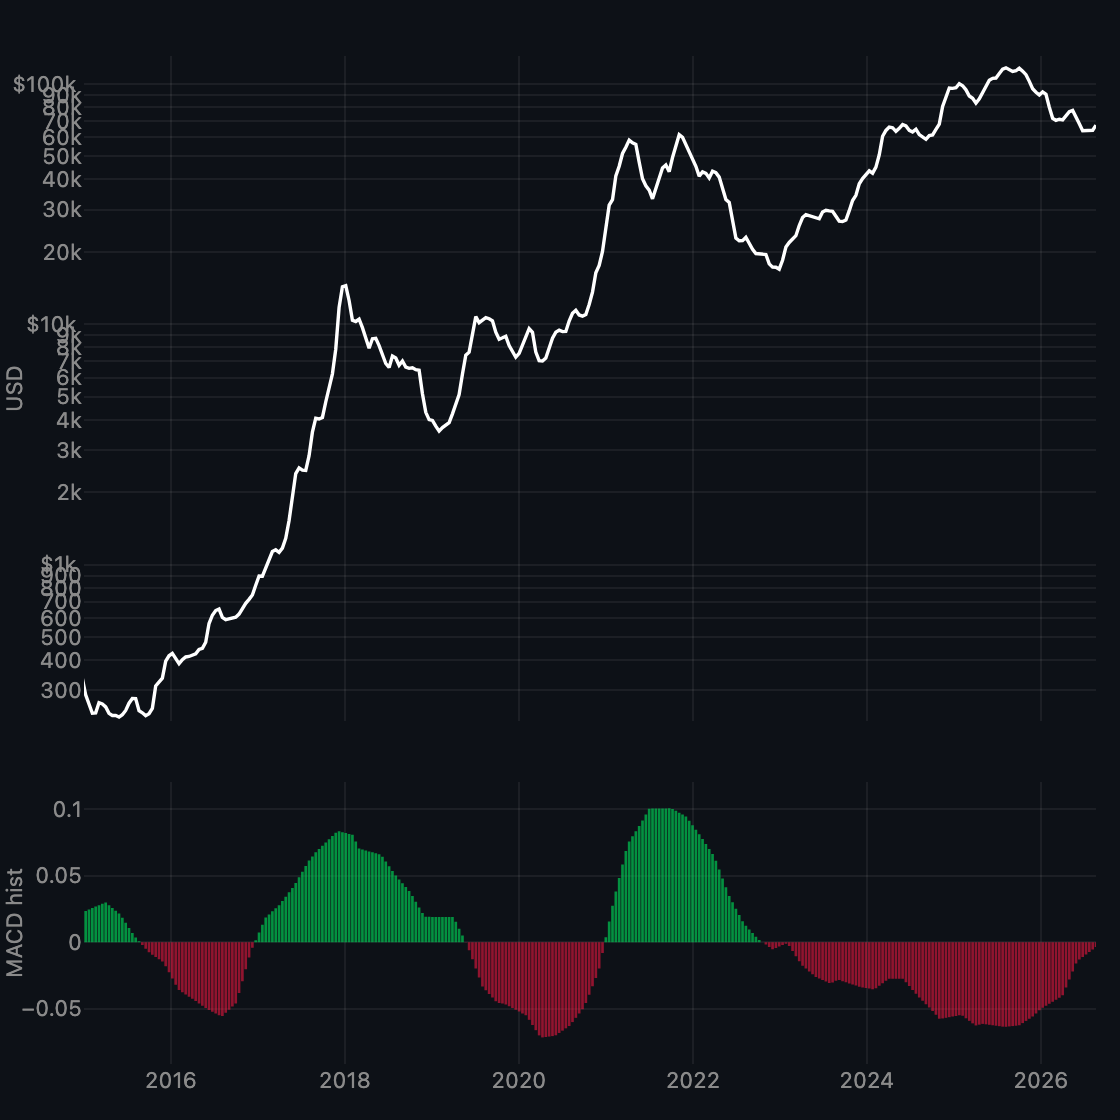
BTC with copper/gold MACD histogram.
-
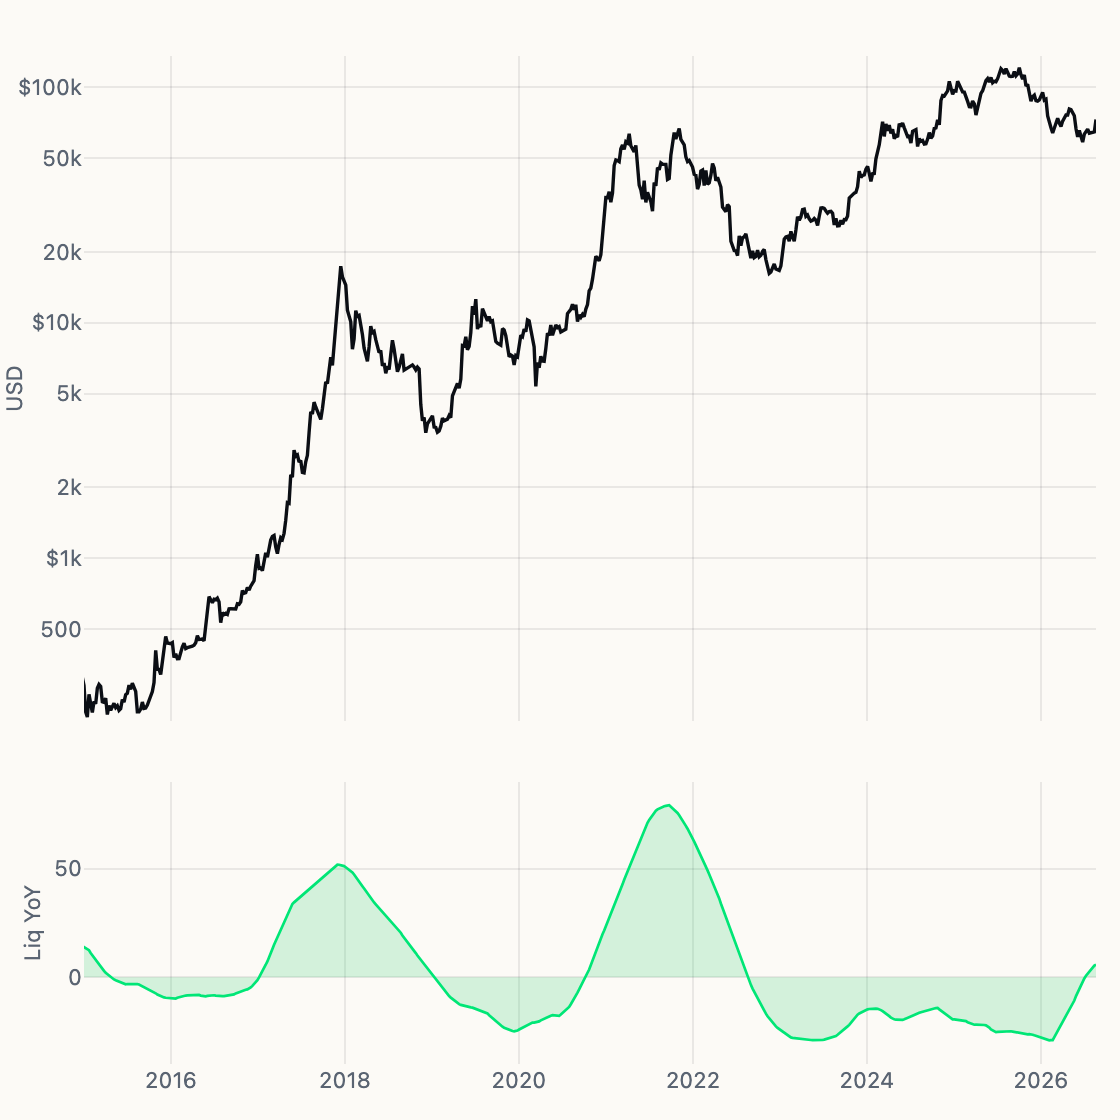
Global Liq YoY
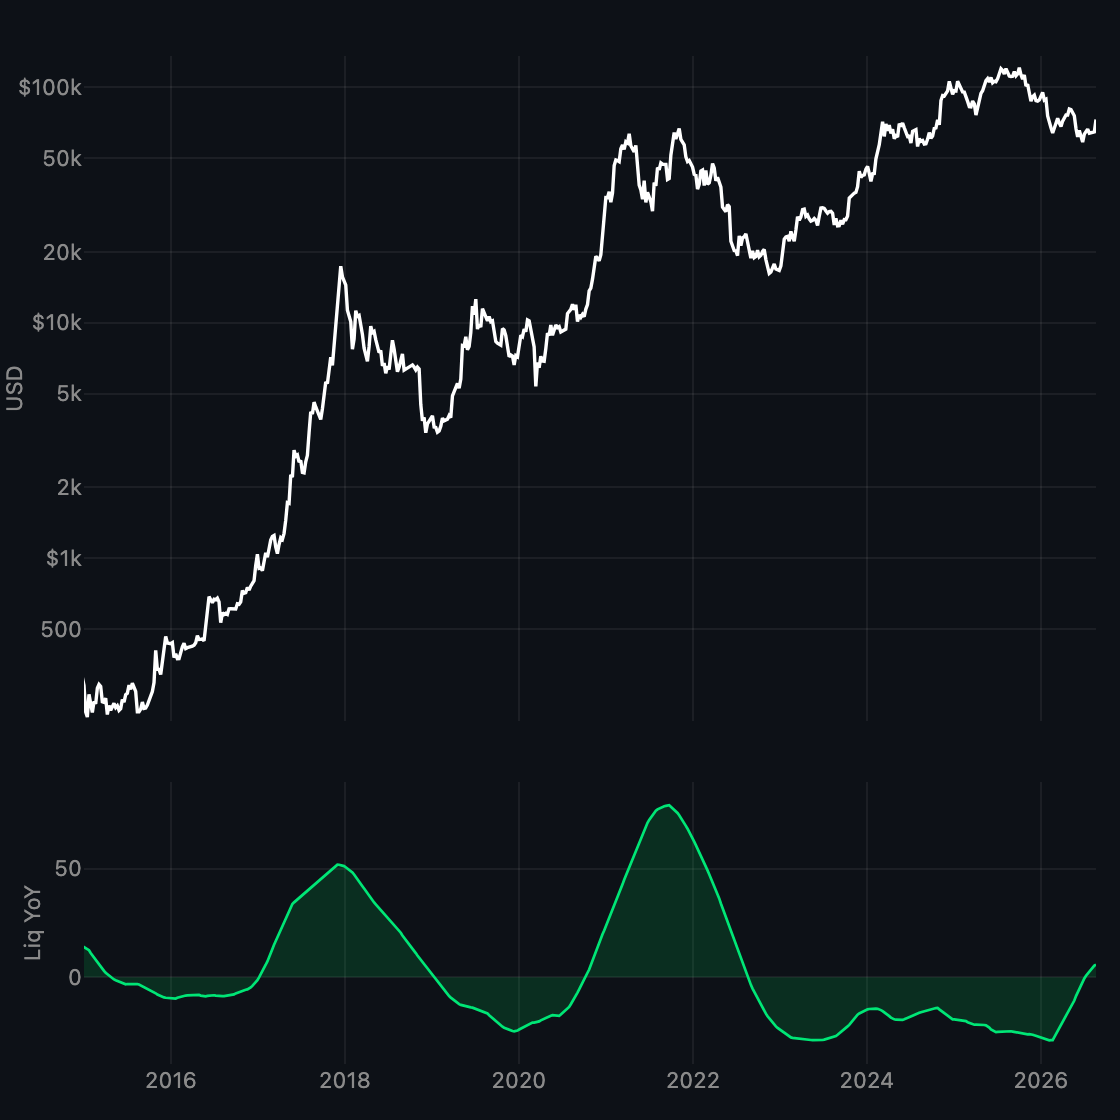
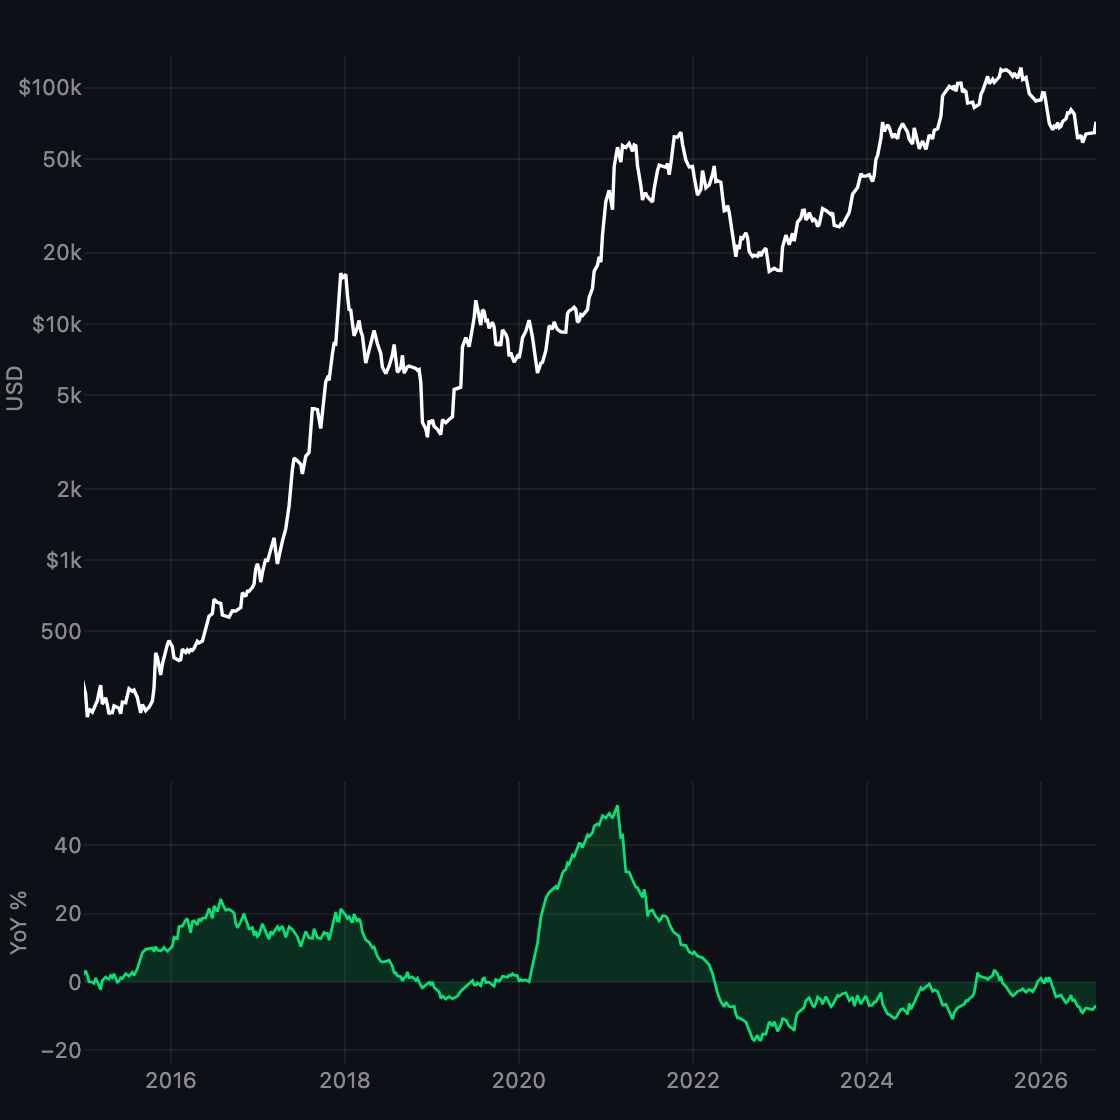
Proprietary global-liquidity YoY pulse vs BTC.
-
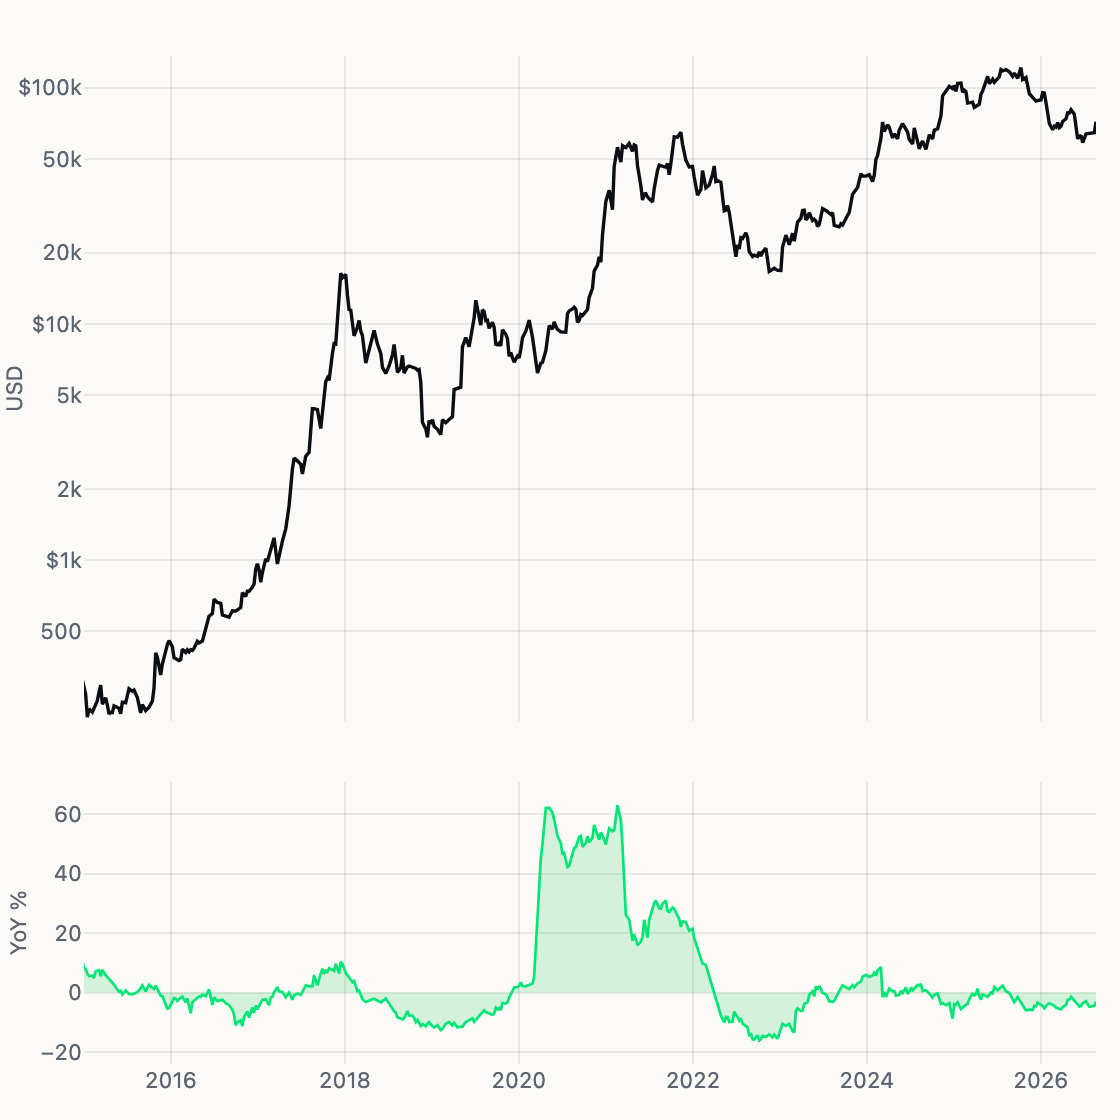
US Net Liquidity
WALCL − TGA − RRP with lag chips.
-
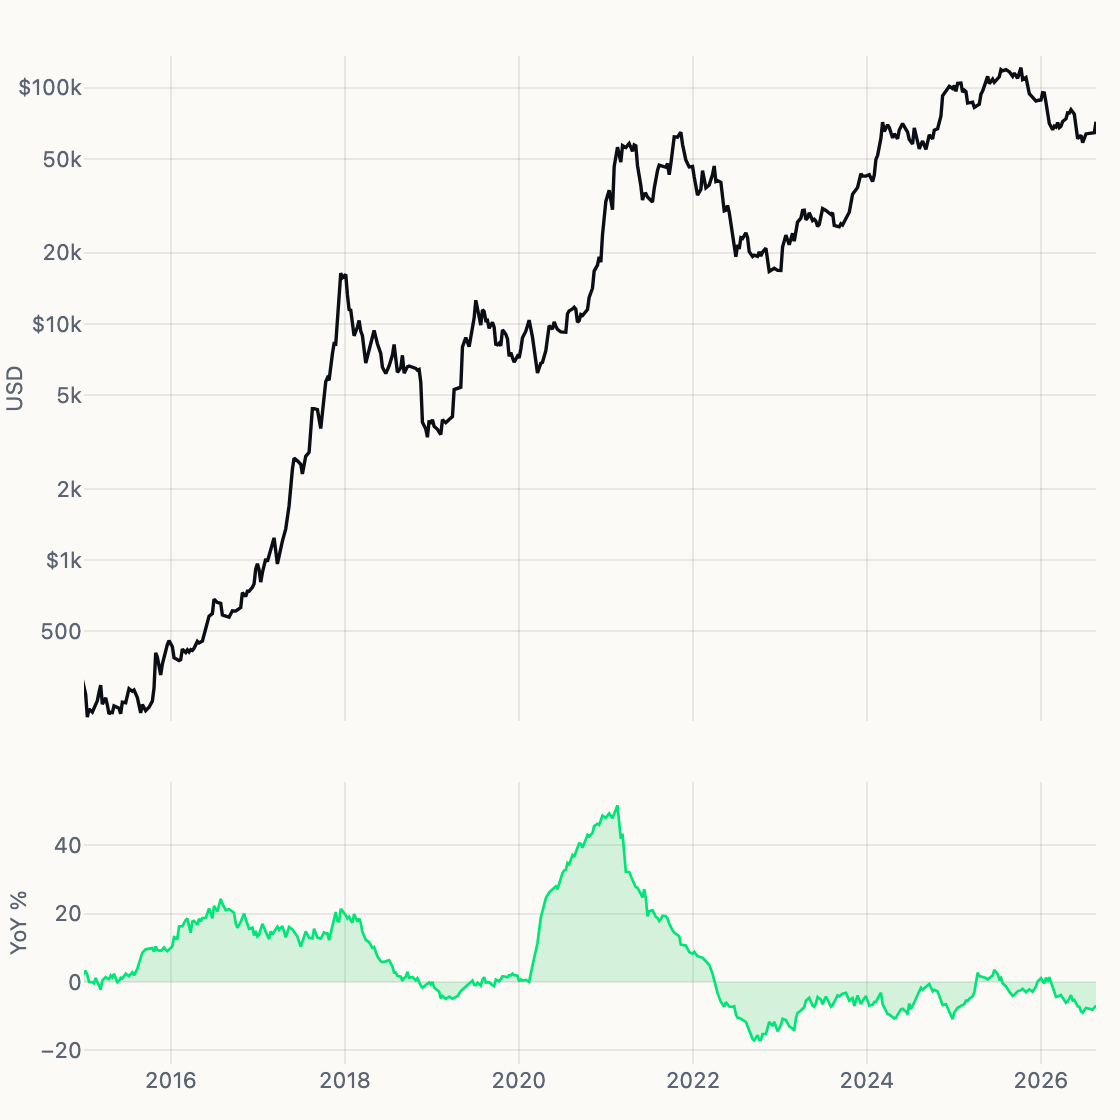
Global Net Liquidity
G3 net liquidity lead tape vs BTC.
-
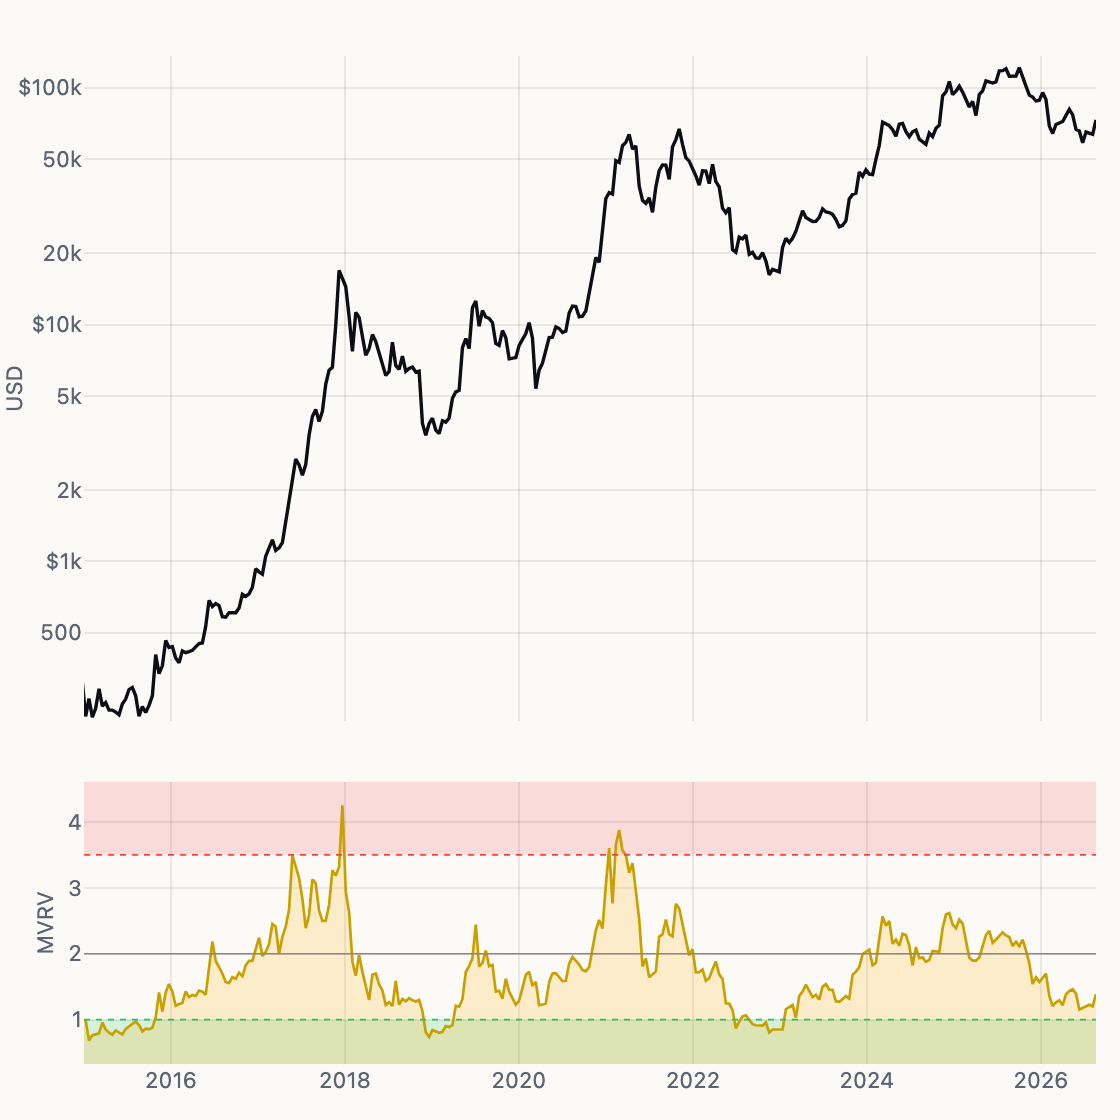
MVRV
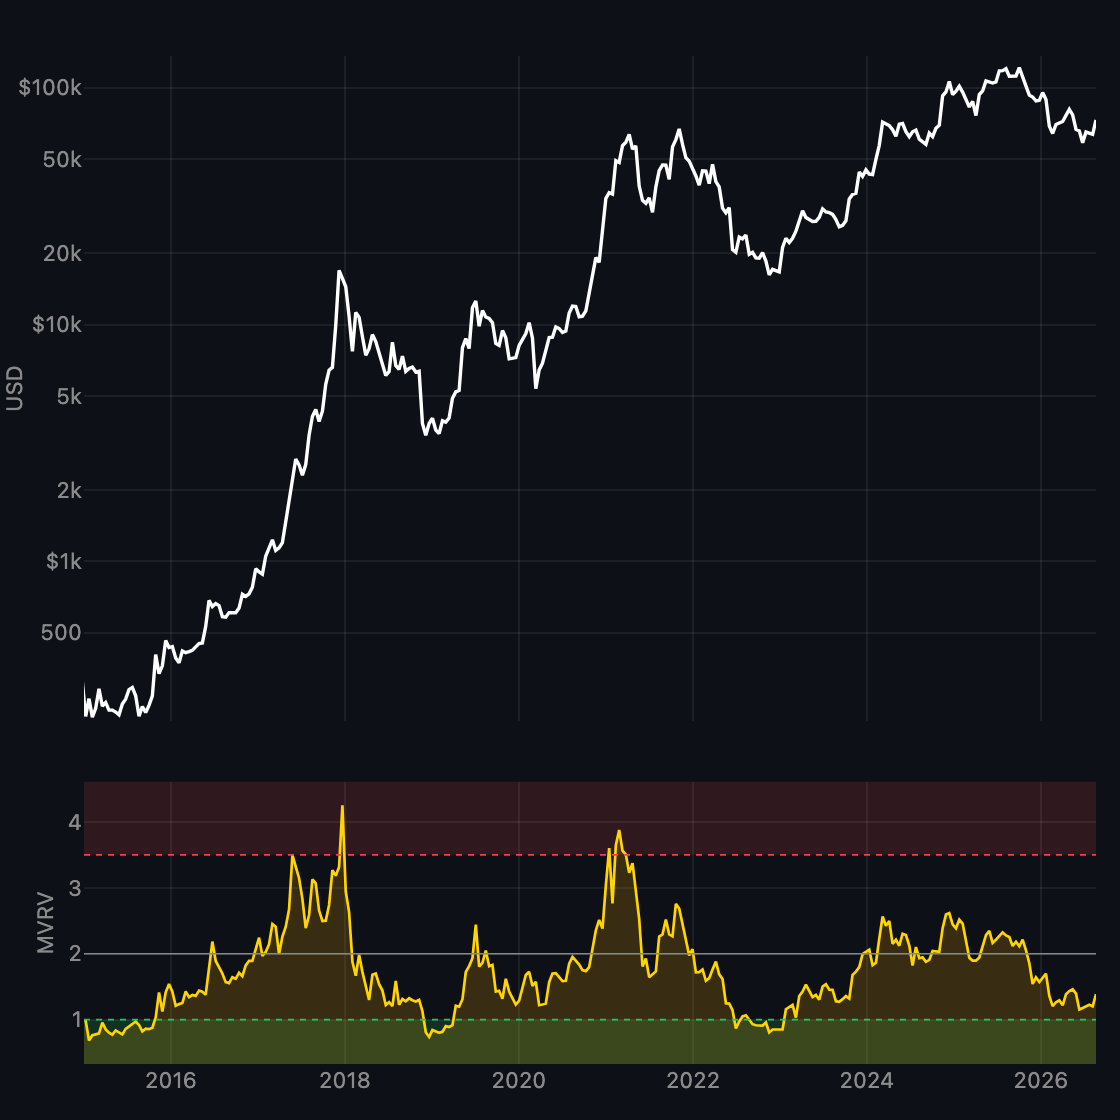
Market value / realized value over time.
-
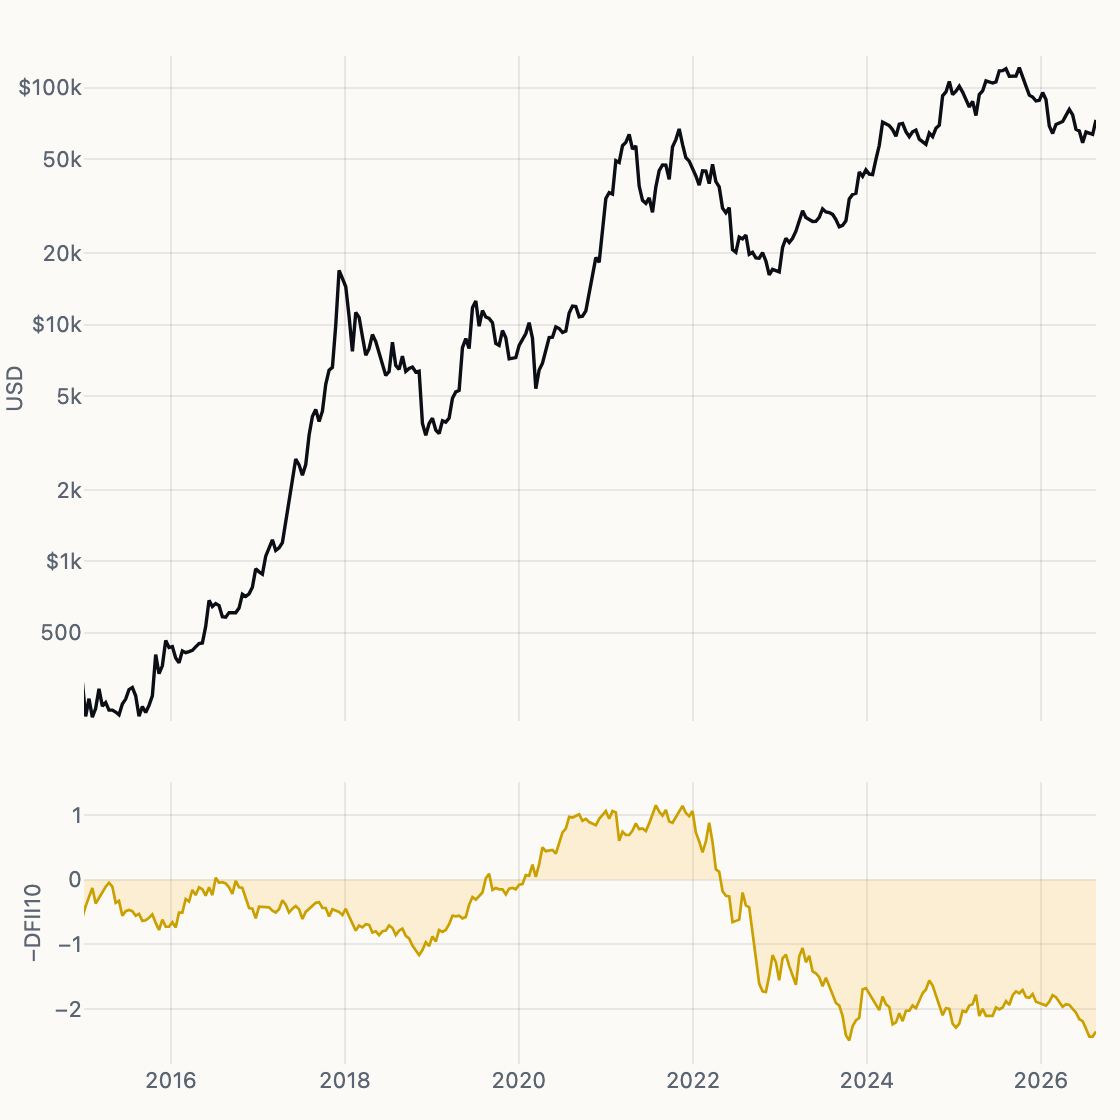
Real Yield (Inv)
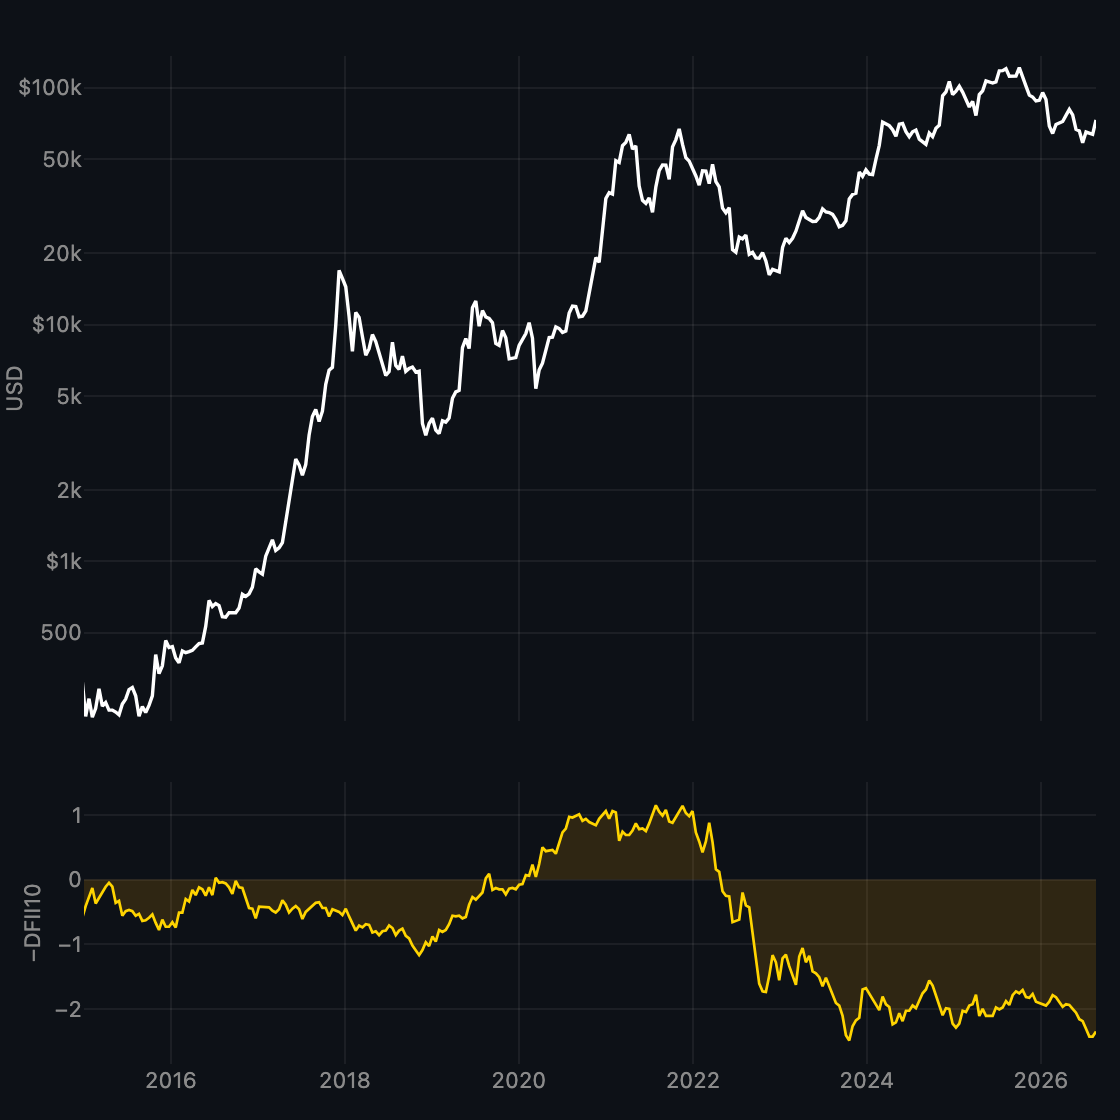
Inverted 10-year TIPS real yield vs BTC.
-
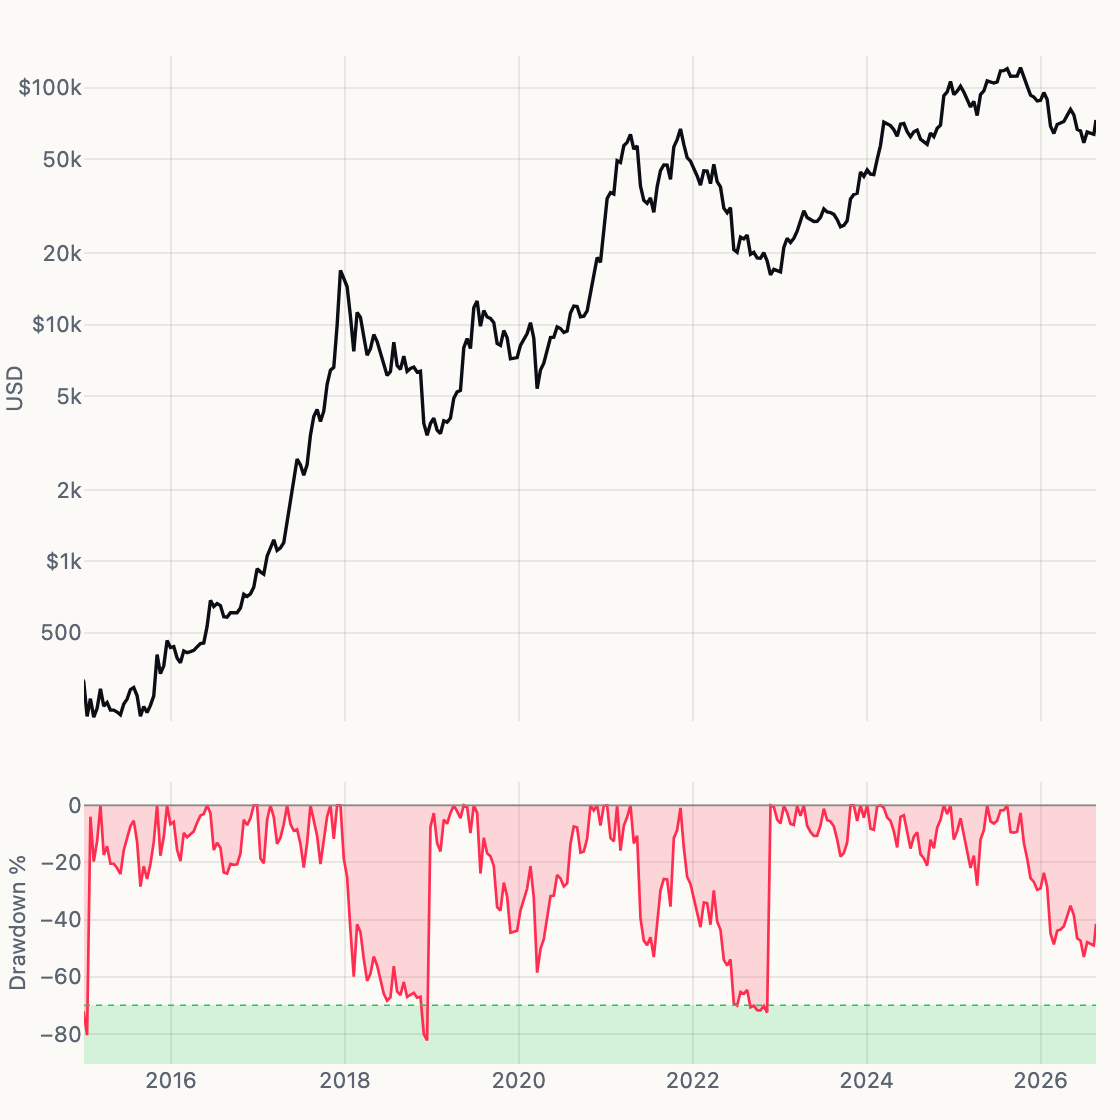
Drawdown
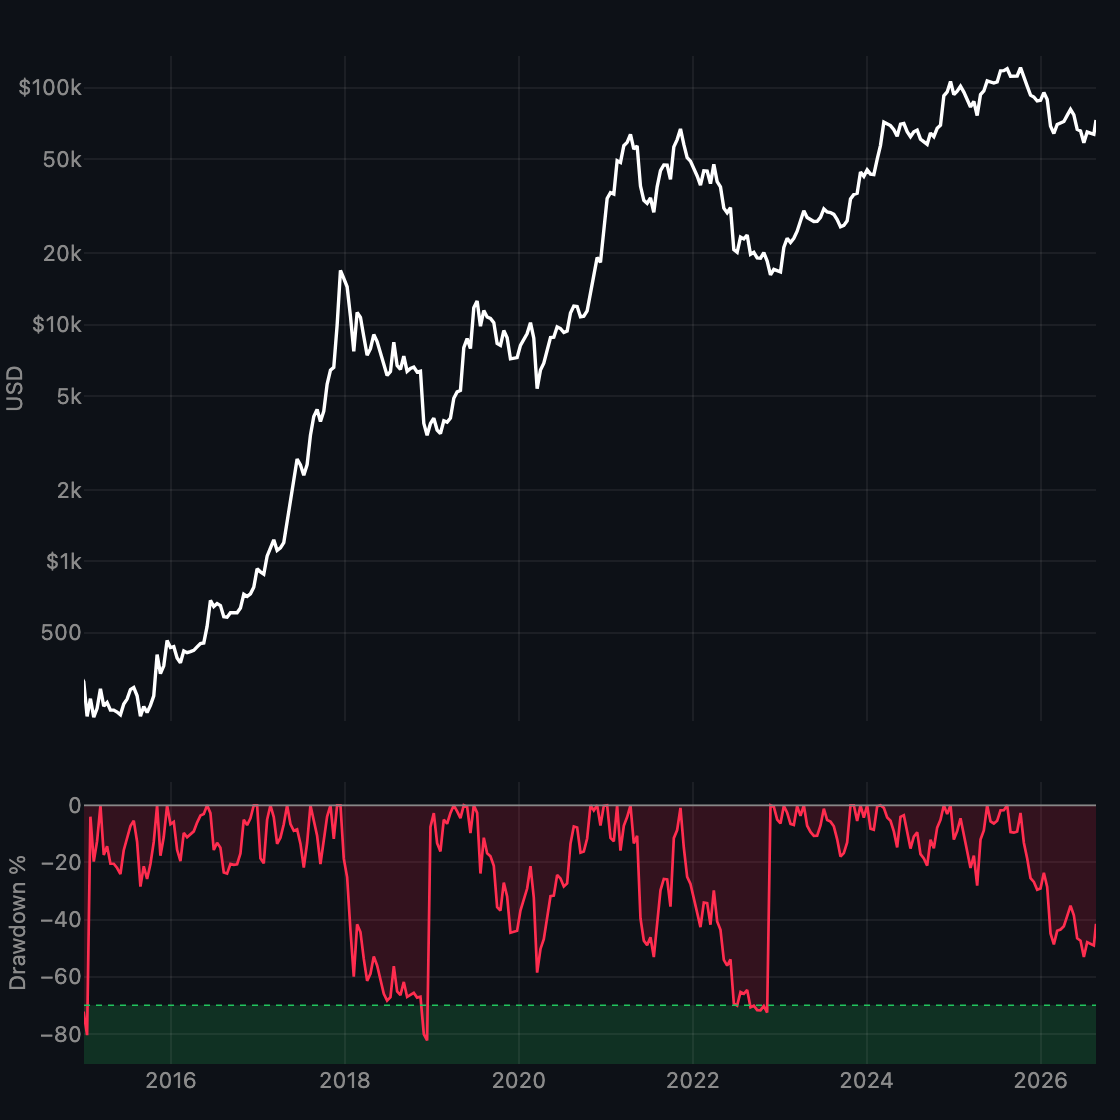
Cycle drawdown from prior highs.
-
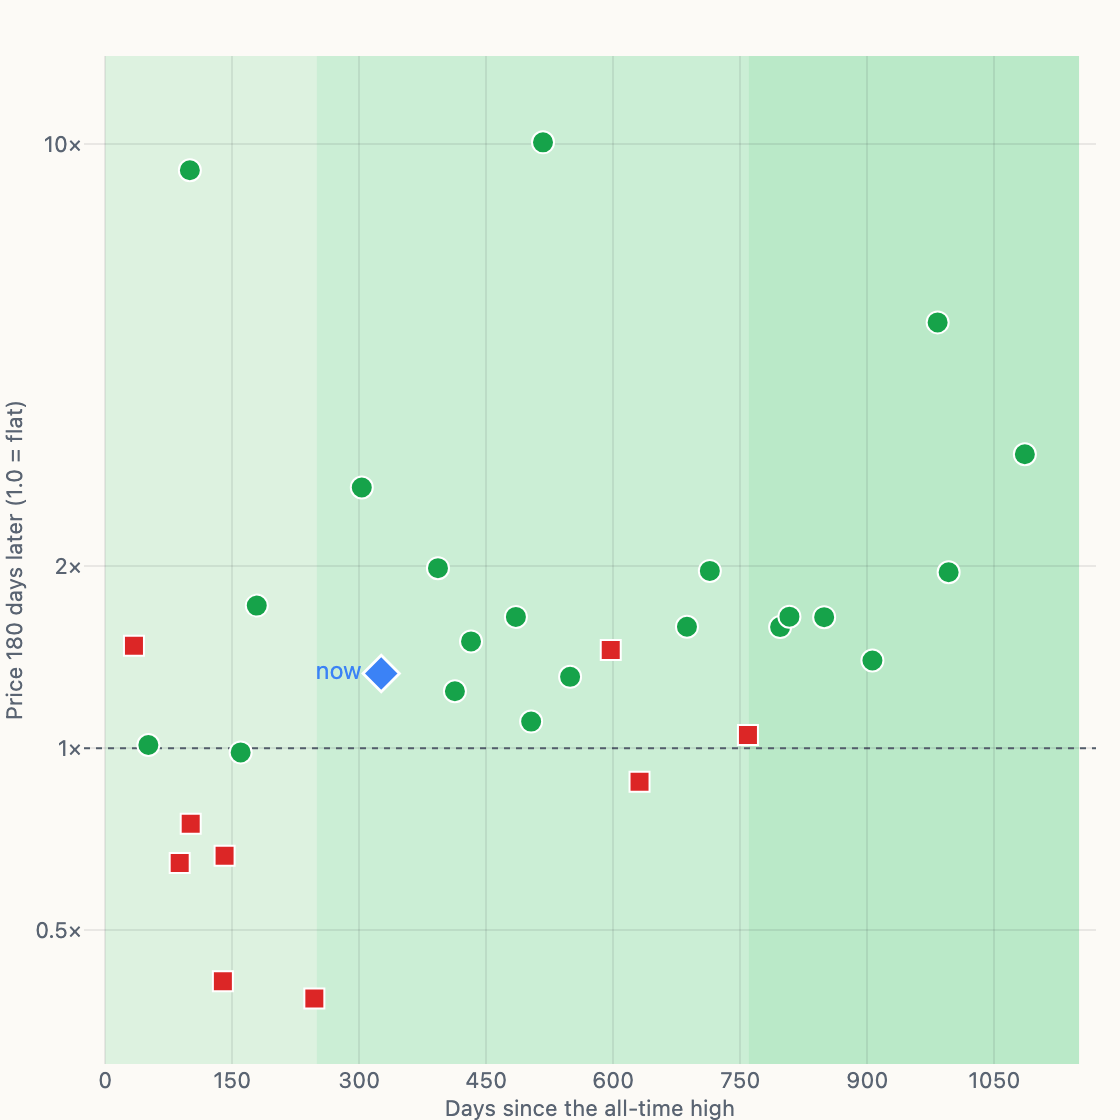
Bear Market Rallies
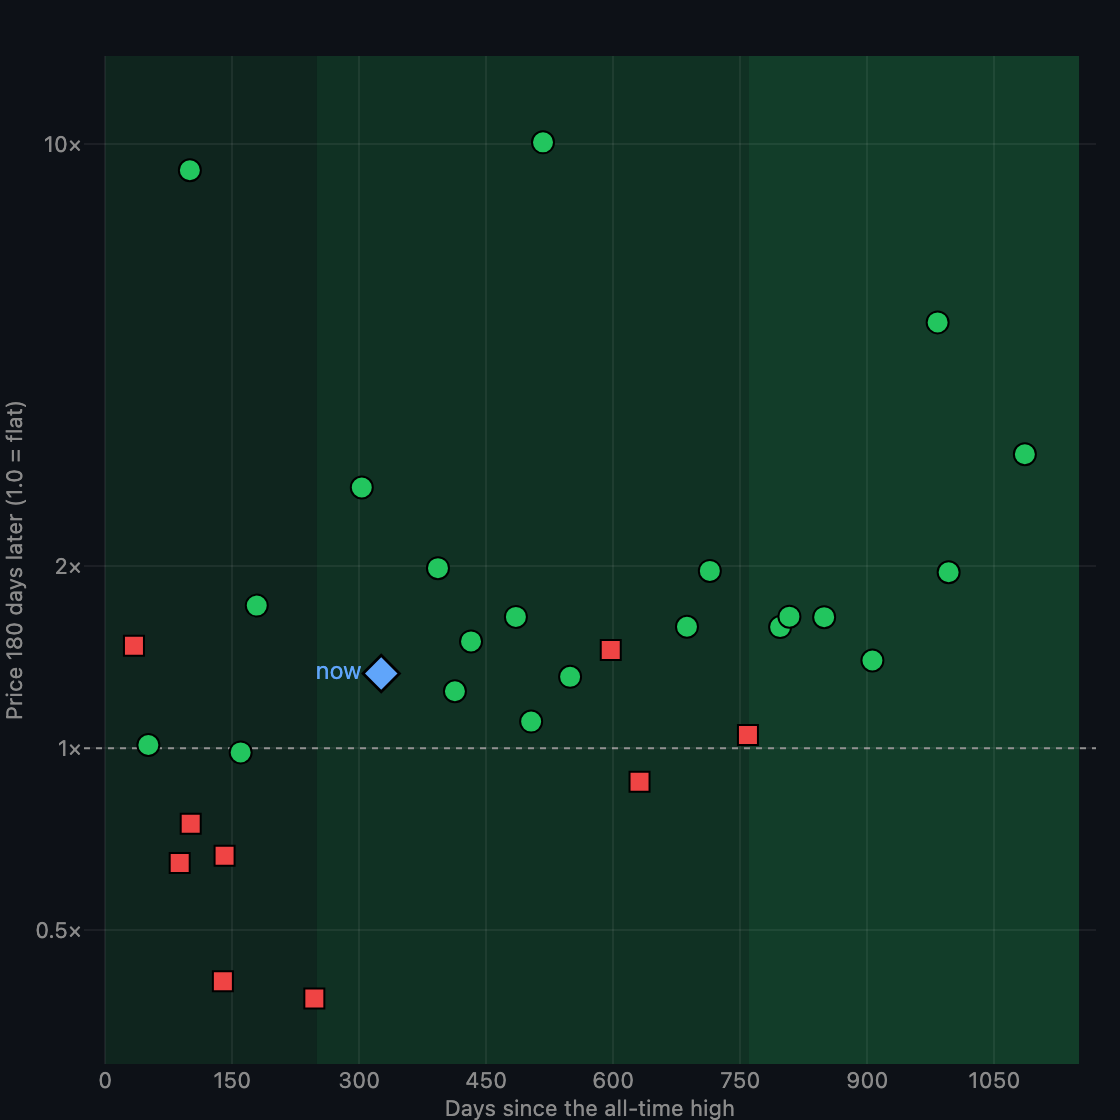
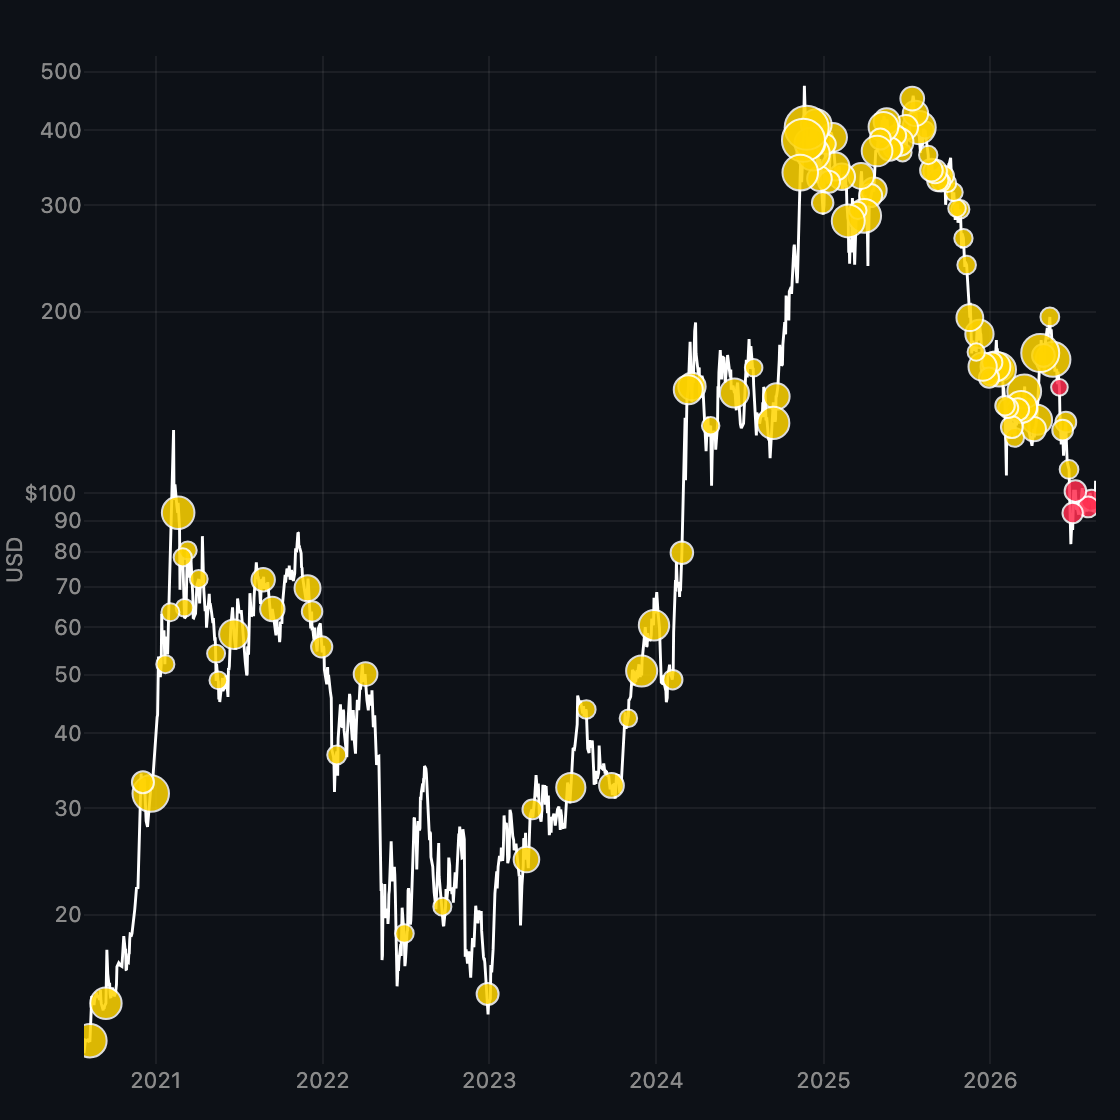
Bounce-stage samples while >30% below the ATH. Green = the prior low held 180 days; red = it was undercut.
-
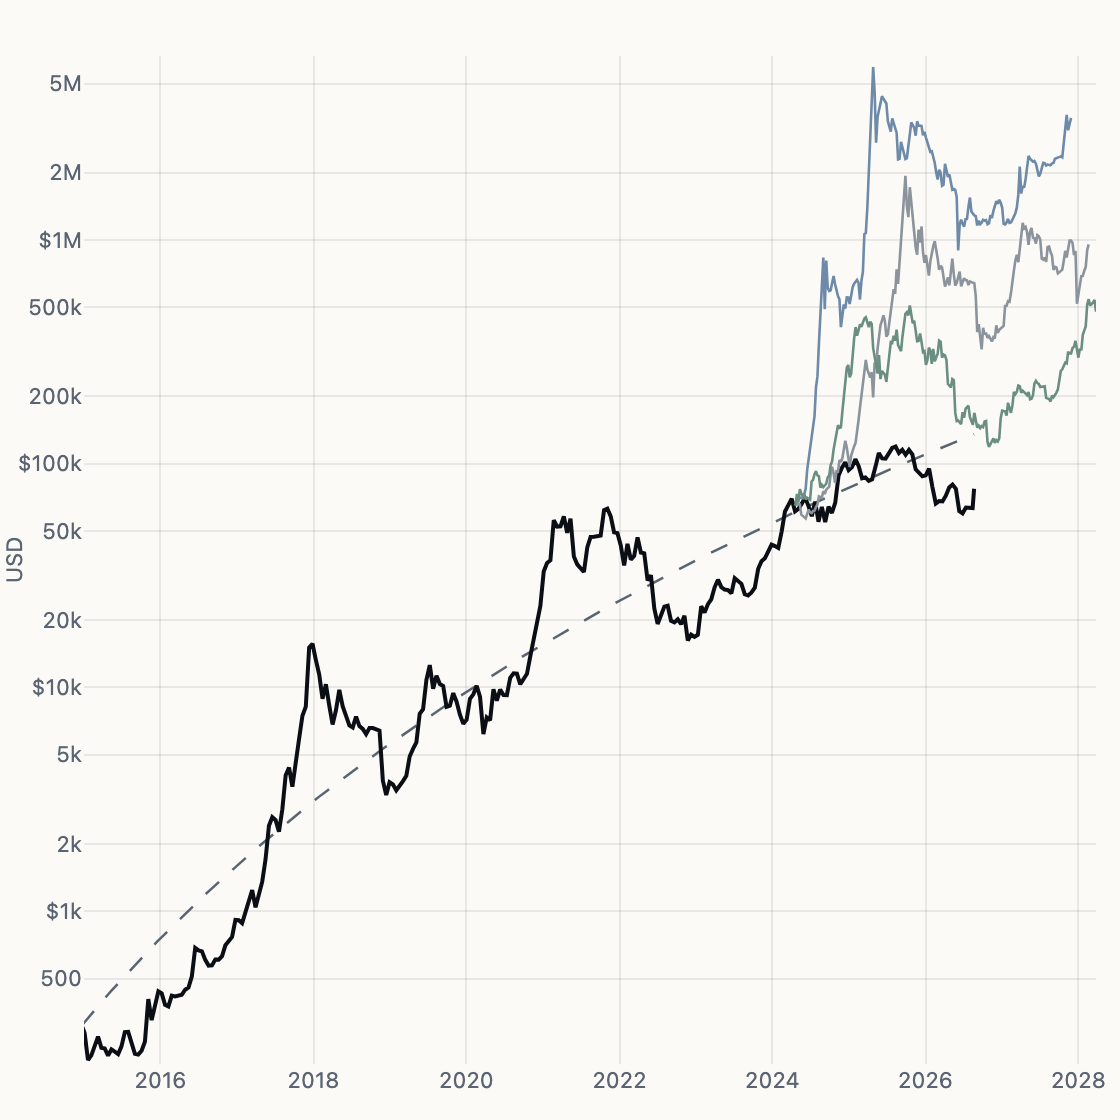
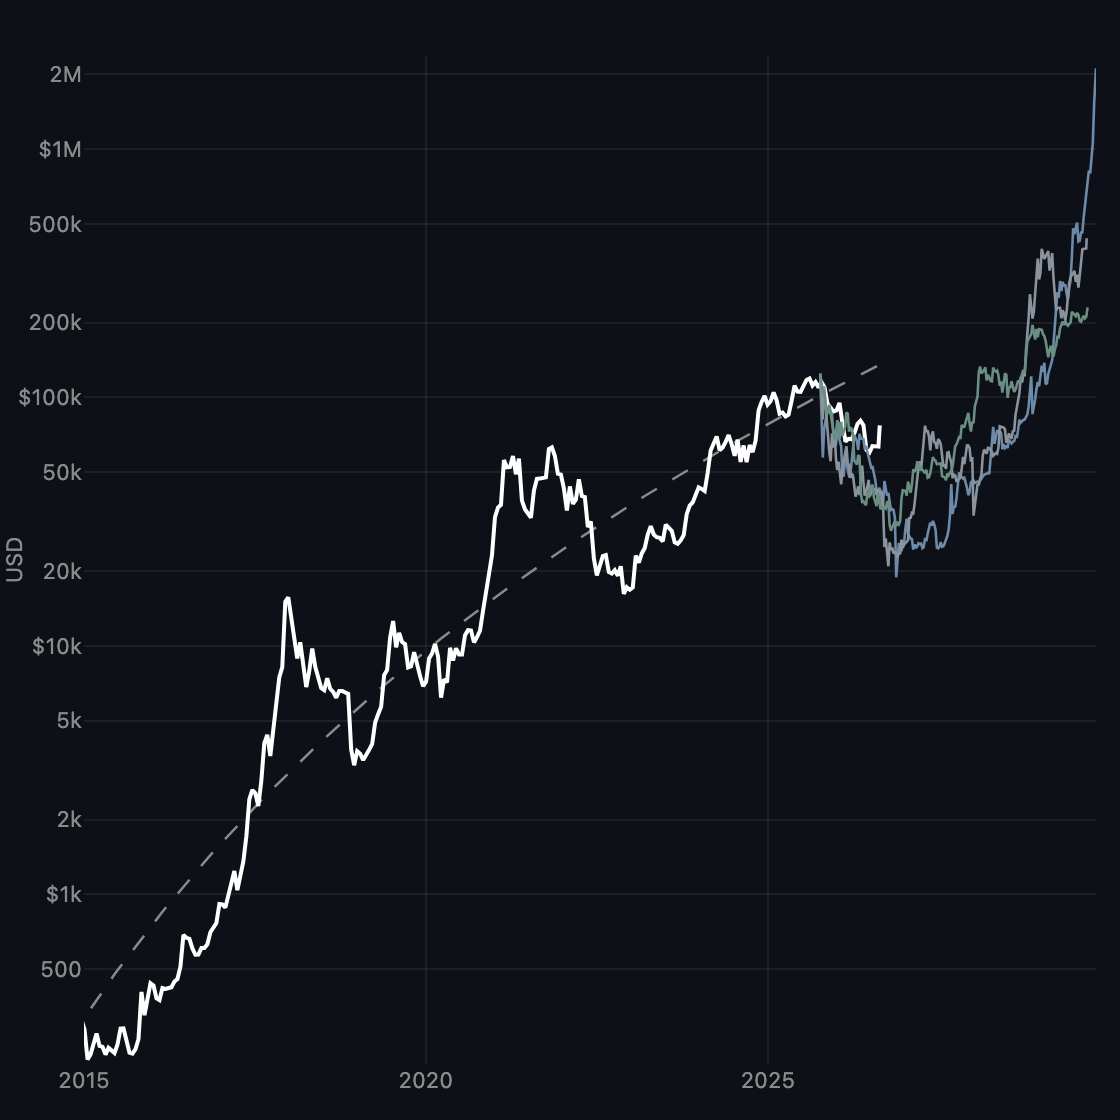
Halving Overlay
Prior epoch analogs indexed from each halving.
-
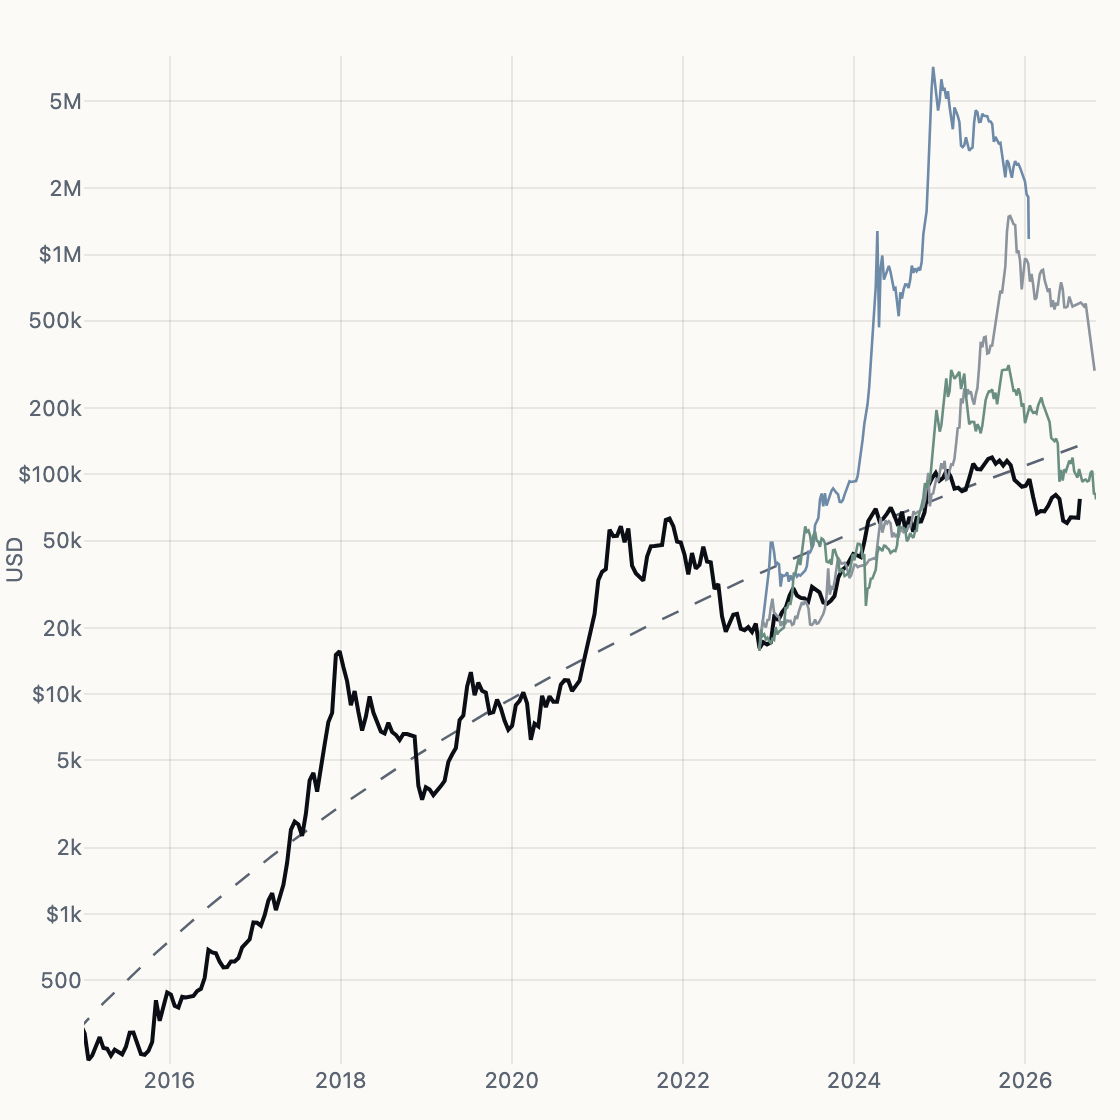
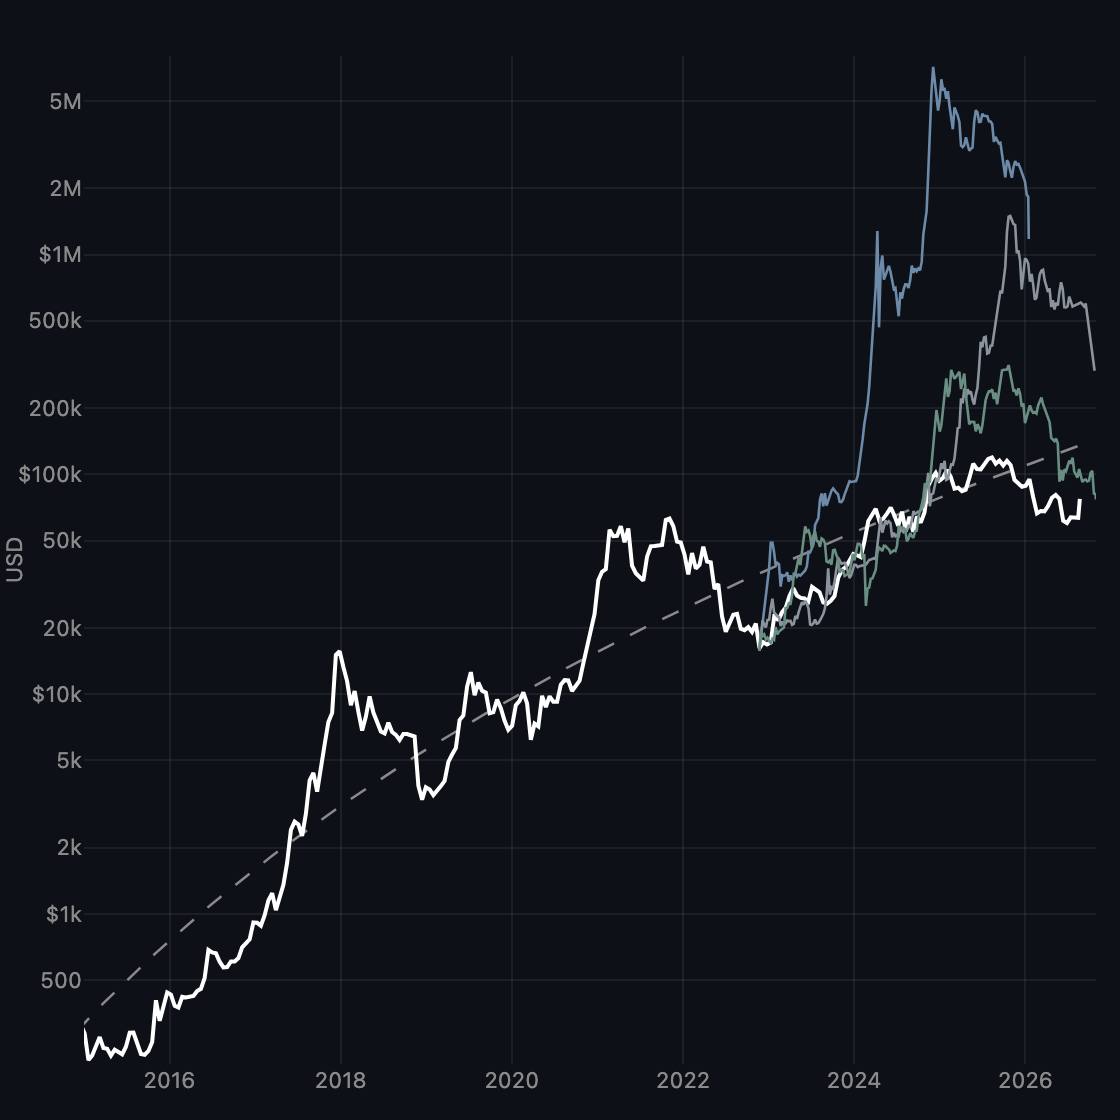
Lows Overlay
Cycle-low analogs overlaid on the live path.
-
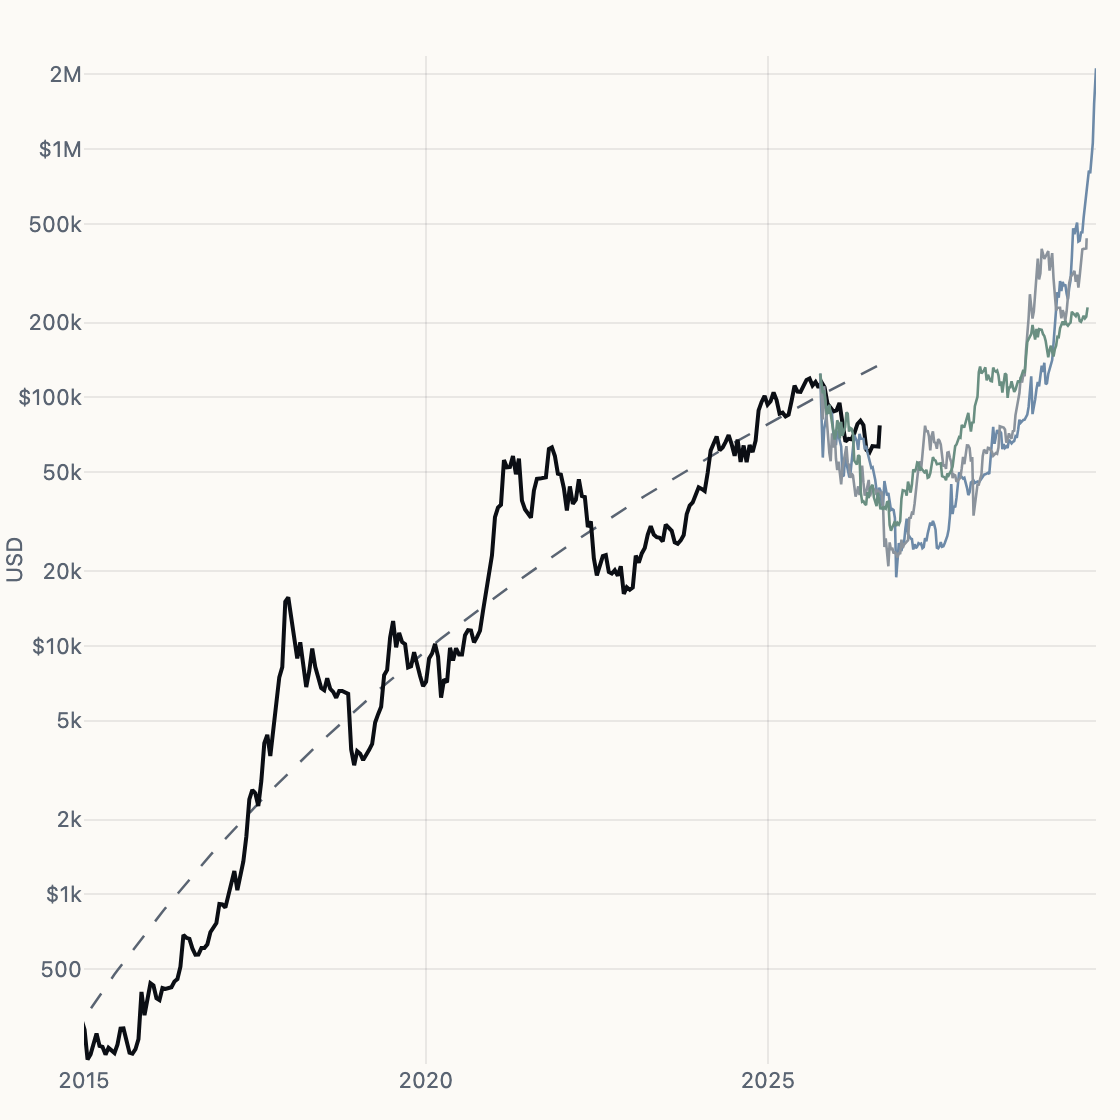
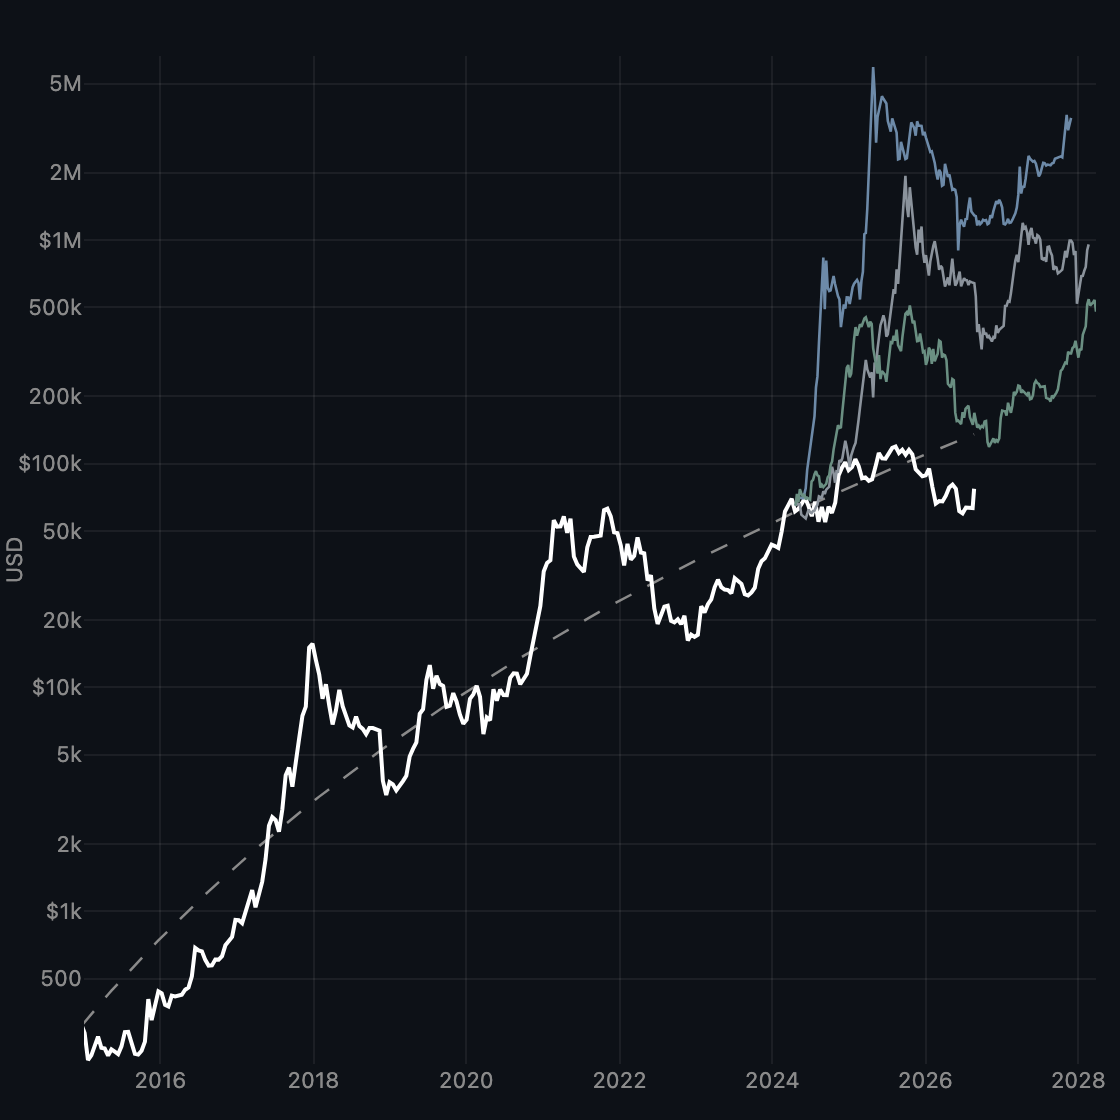
Highs Overlay
Cycle-high analogs overlaid on the live path.
-
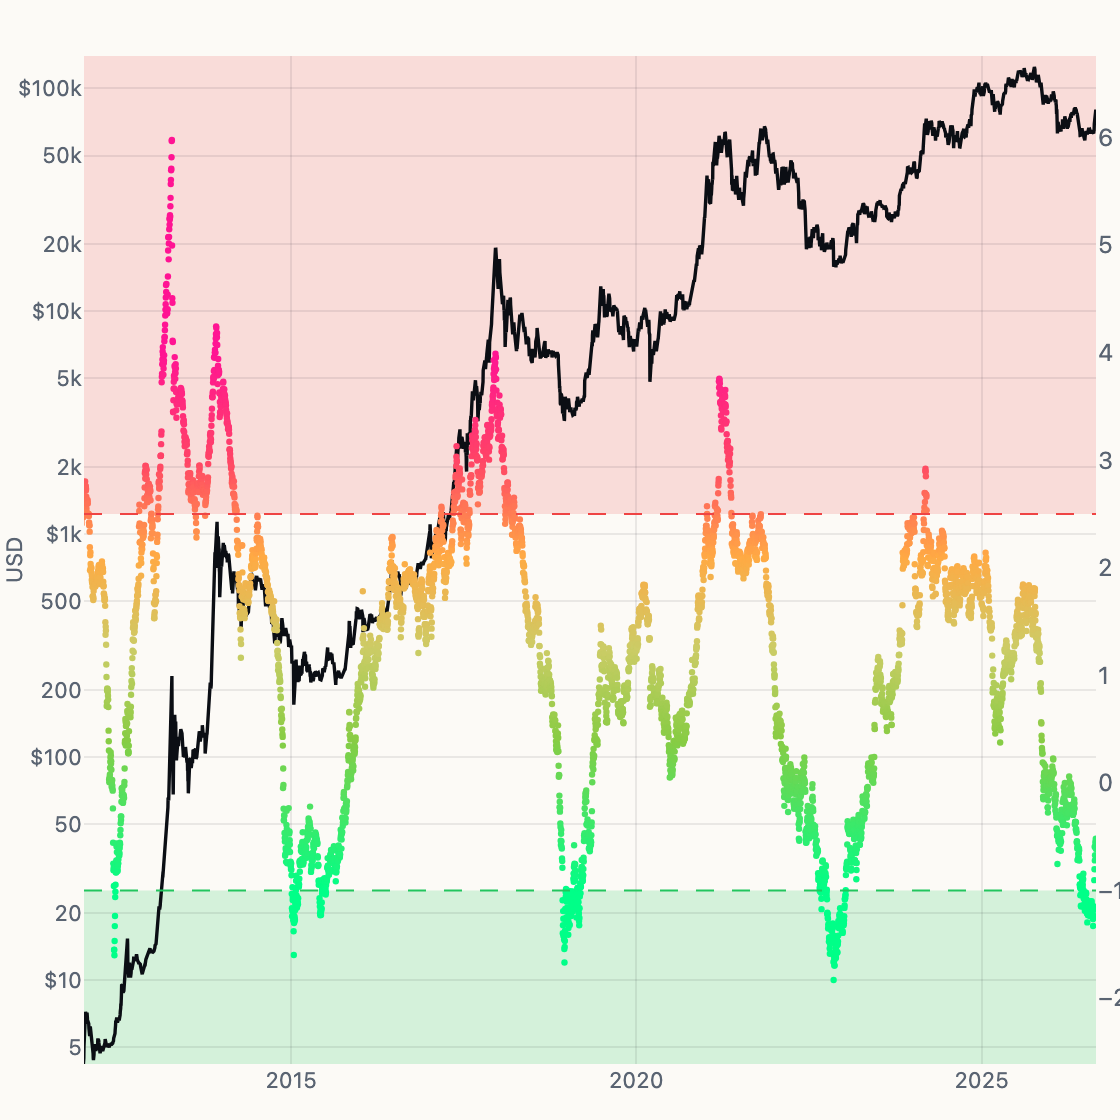
Sharpe Ratio
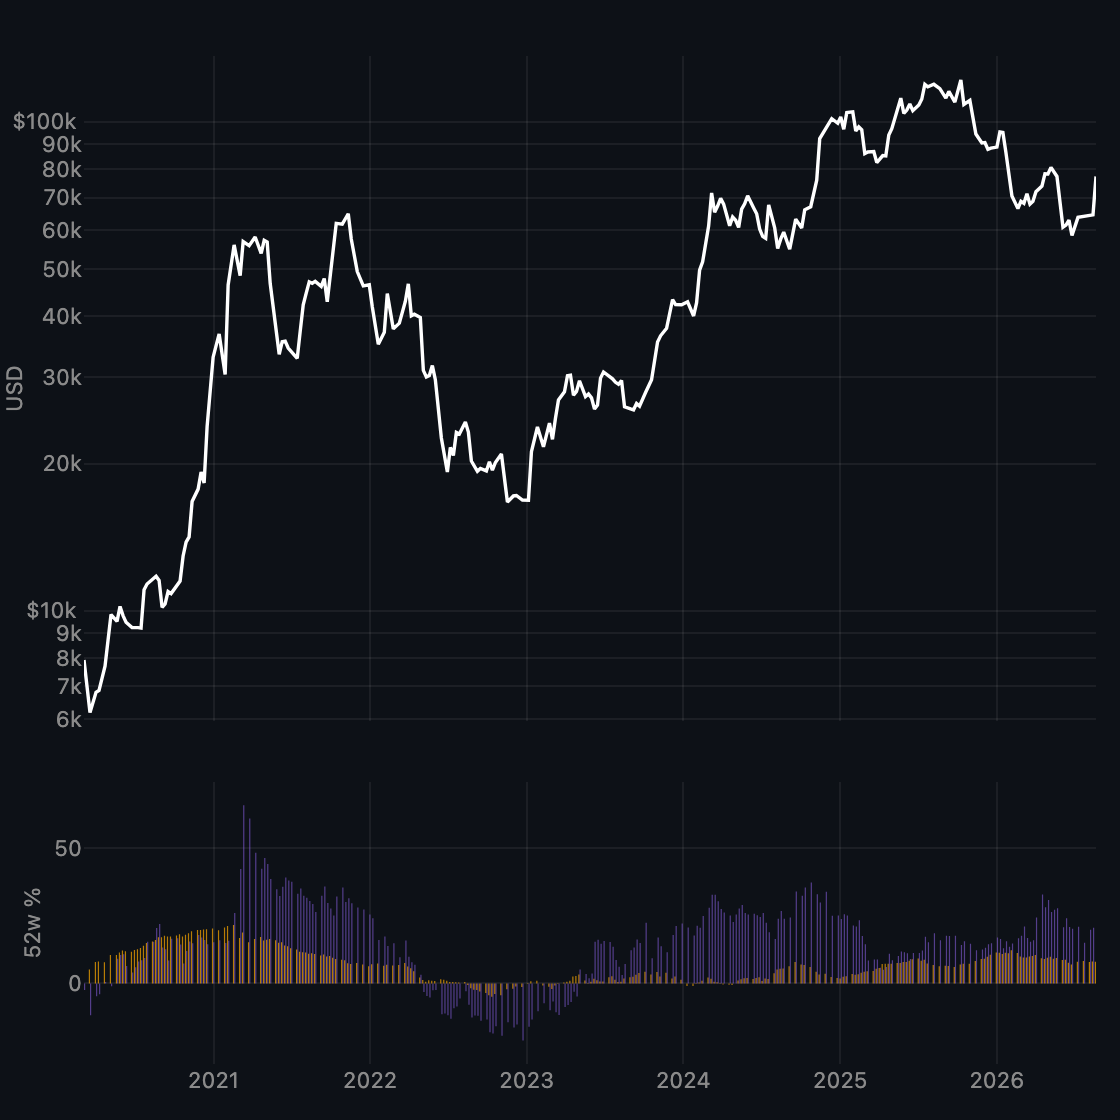
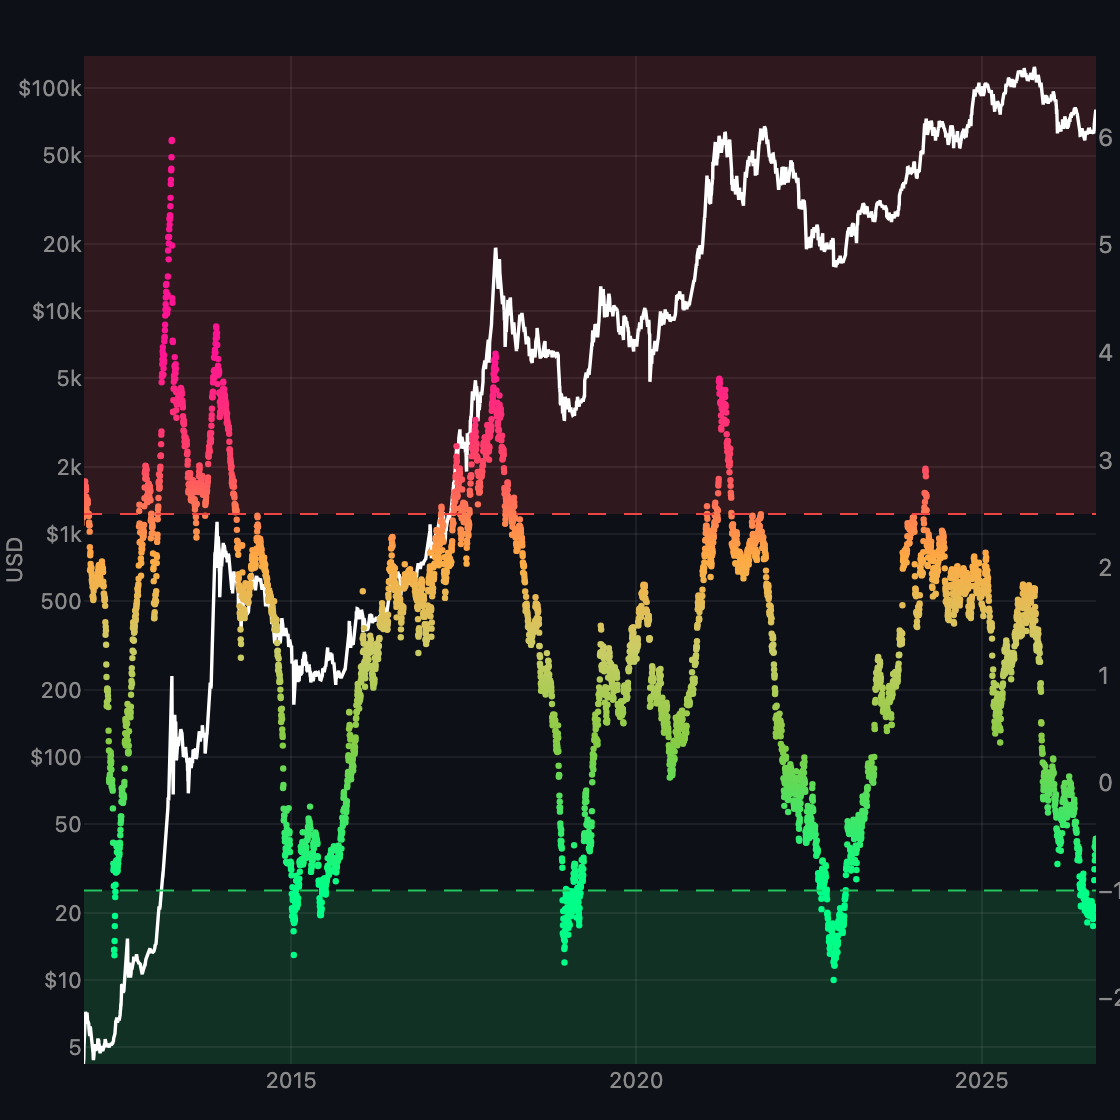
Rolling 1-year return per unit of risk vs price — color-mapped on the price pane.
-
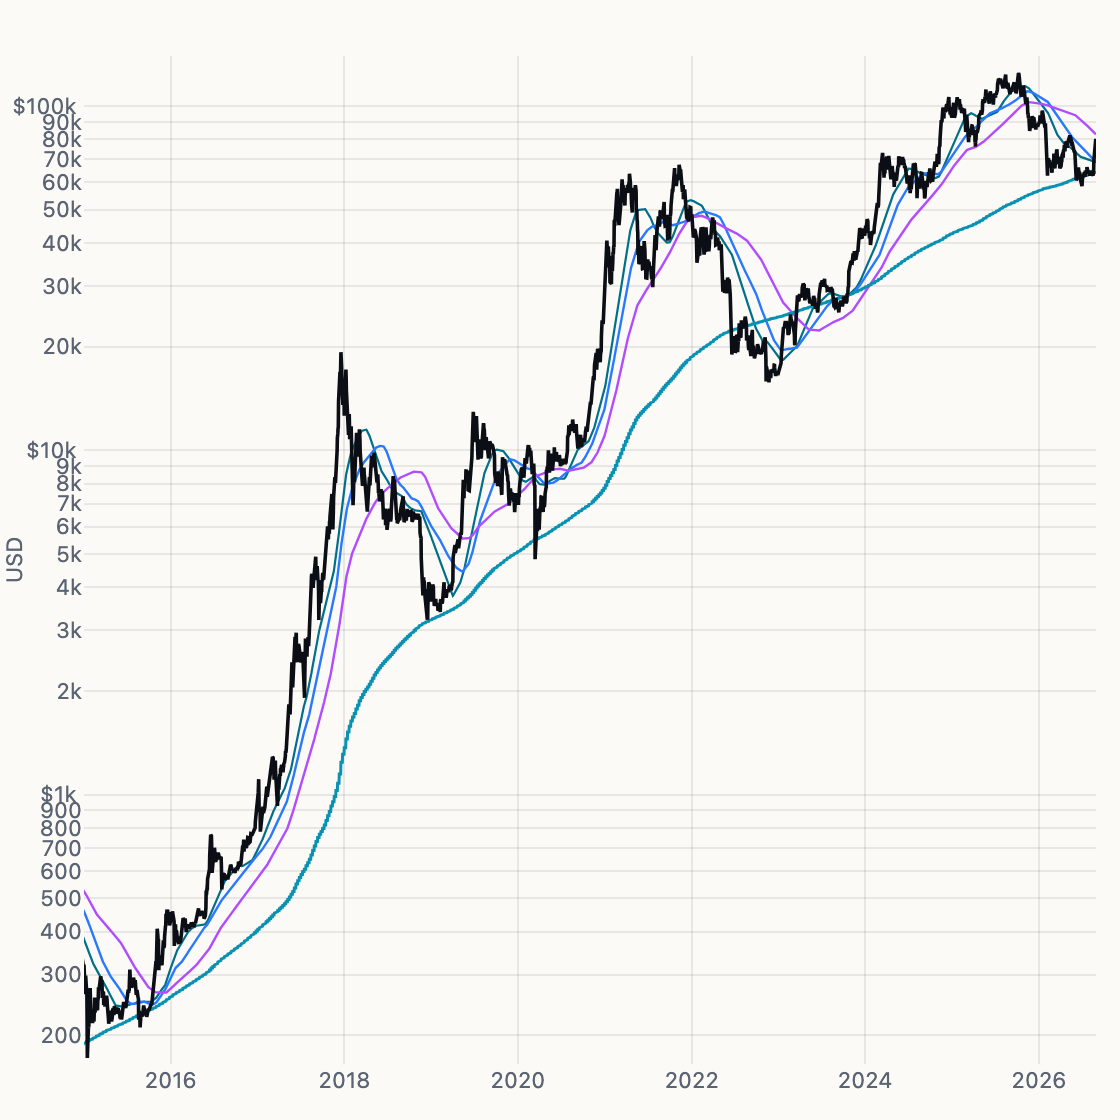
Trend Ladder
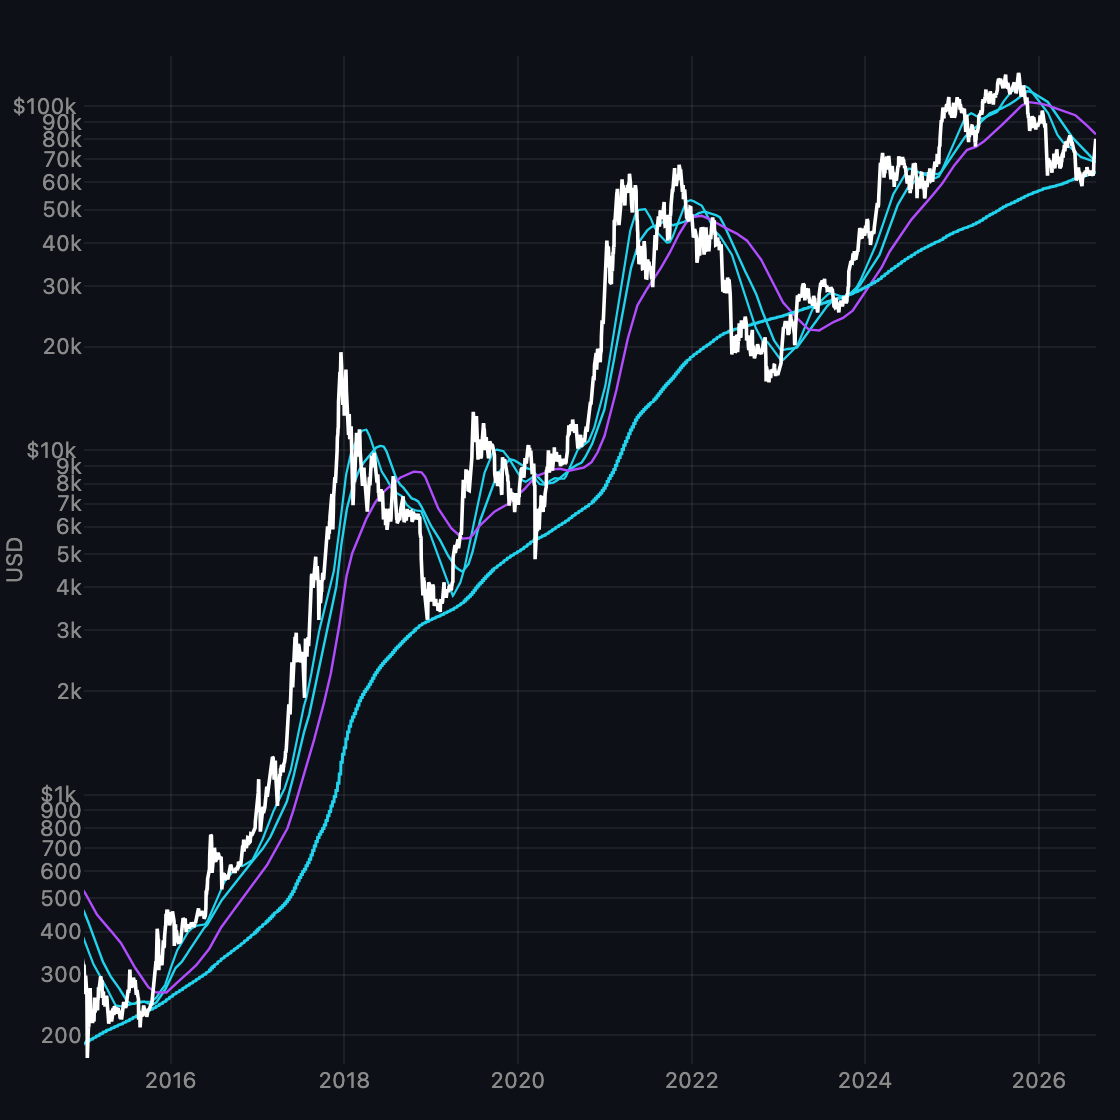
128, 200, 365-day MAs plus the 200-week floor.
-
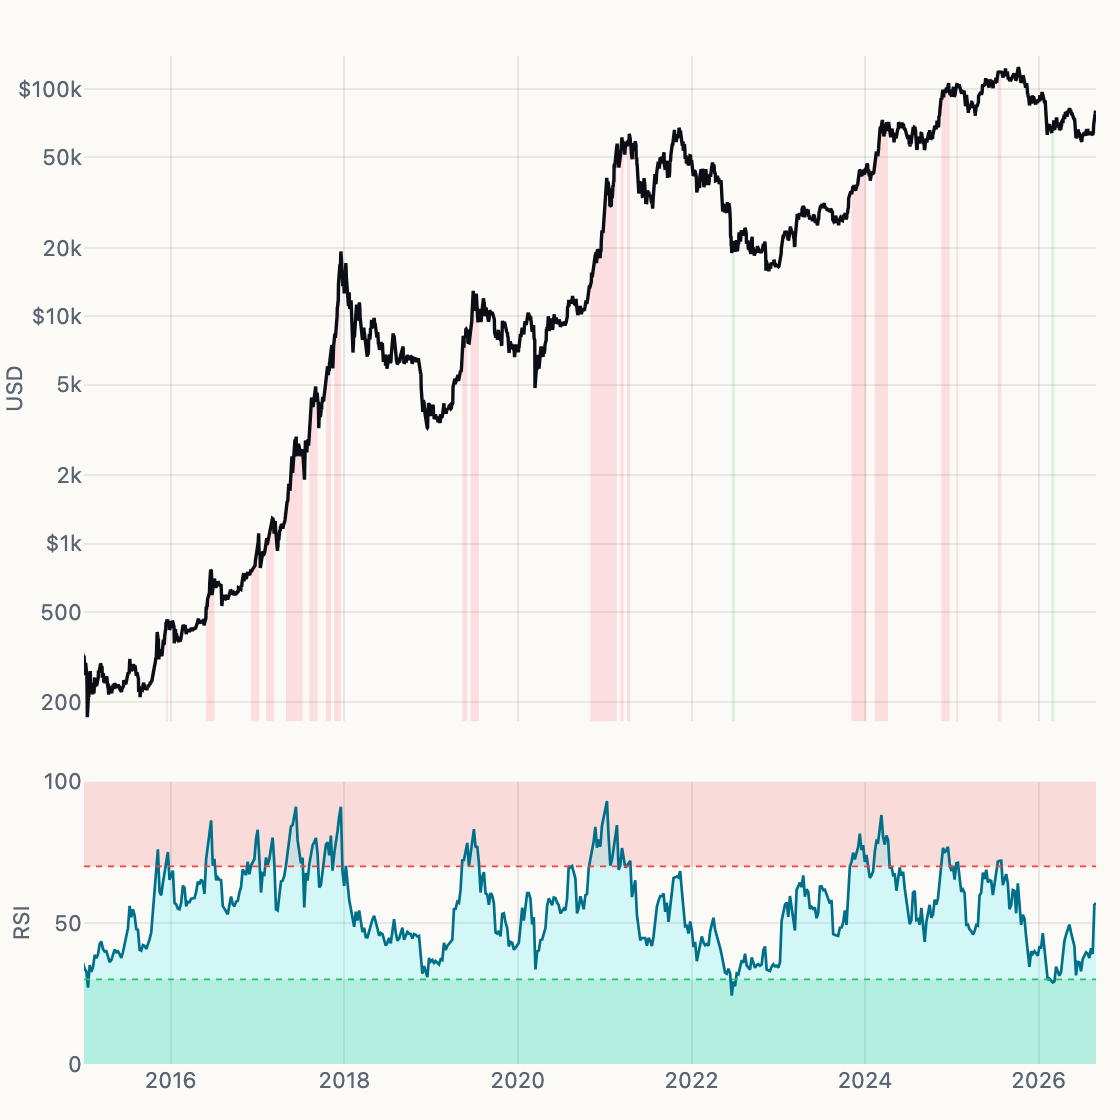
Weekly RSI
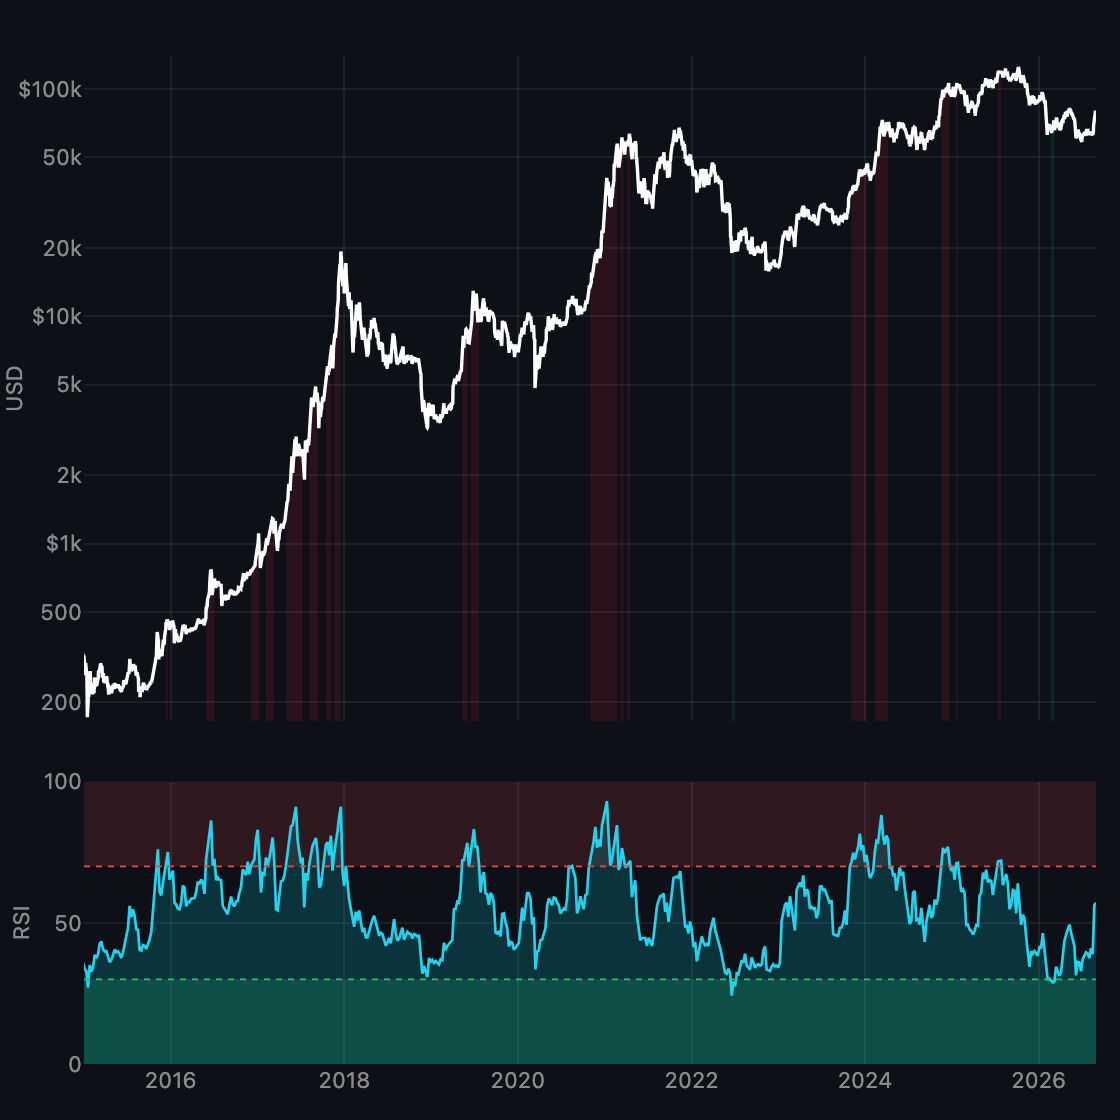
RSI-14 on weekly closes with 30/70 zones.
-
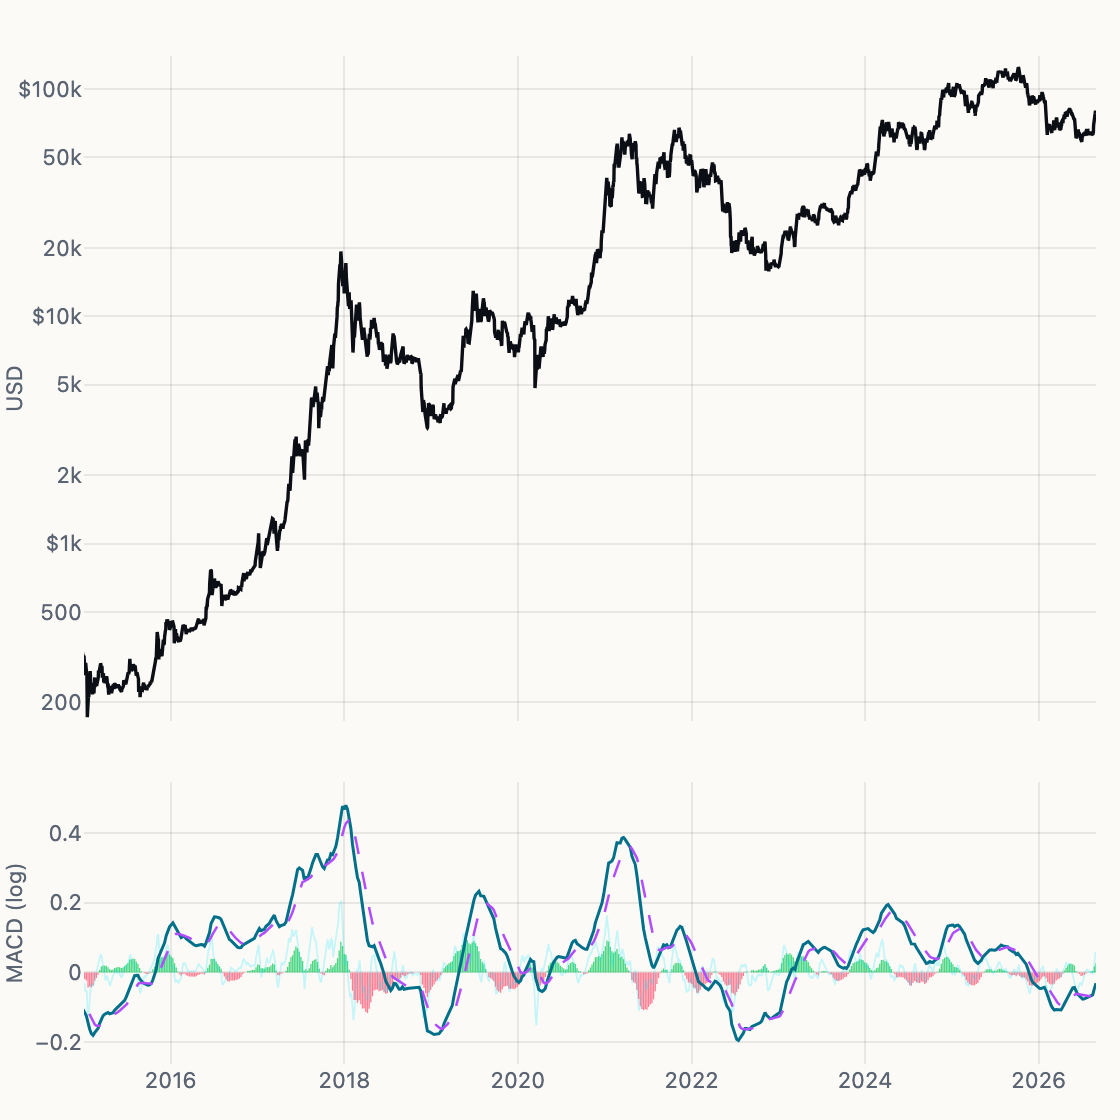
Weekly MACD
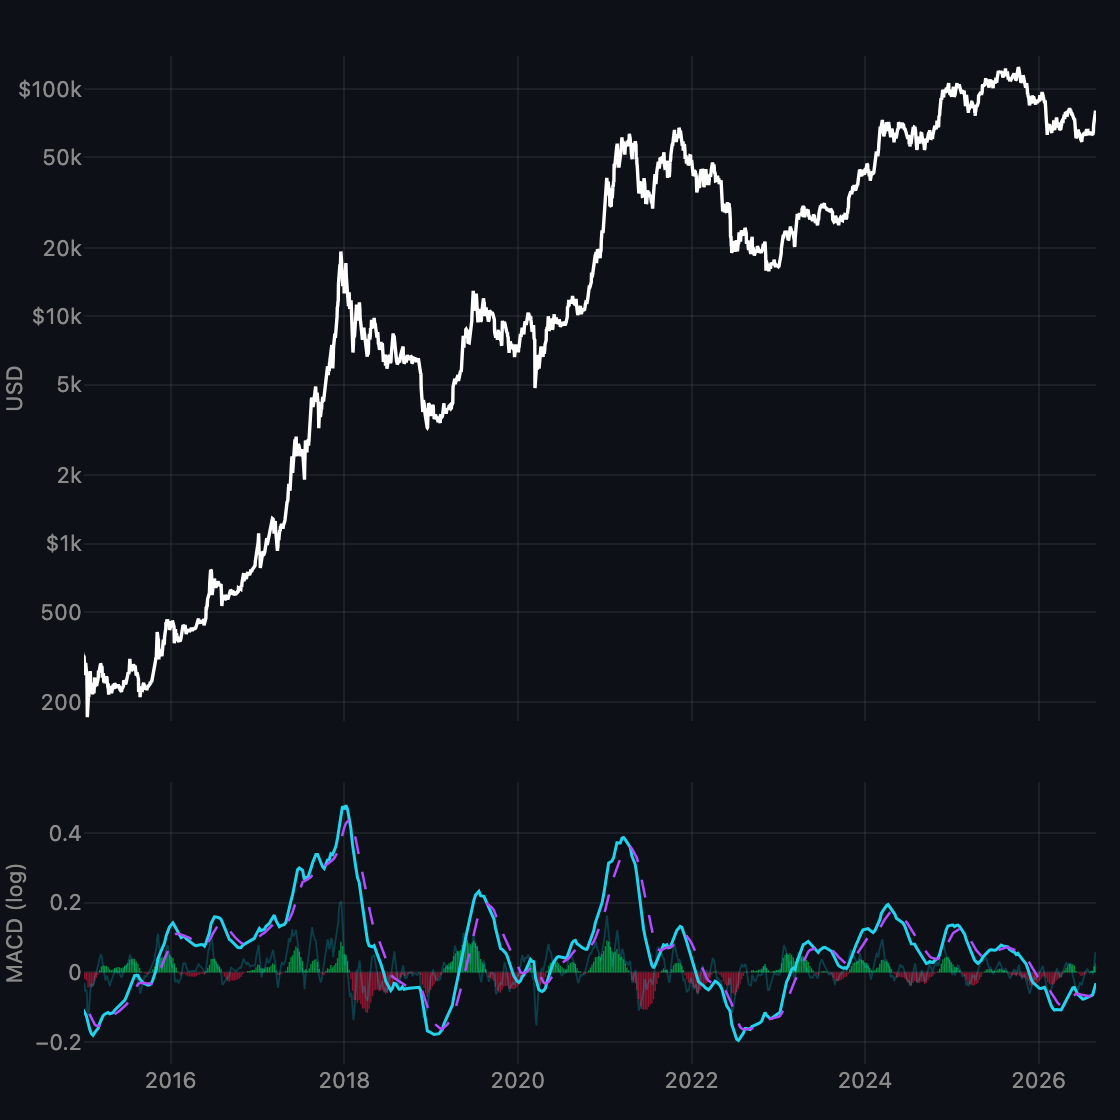
MACD 12/26/9 on weekly ln(price) so early and late cycles share a scale.
-
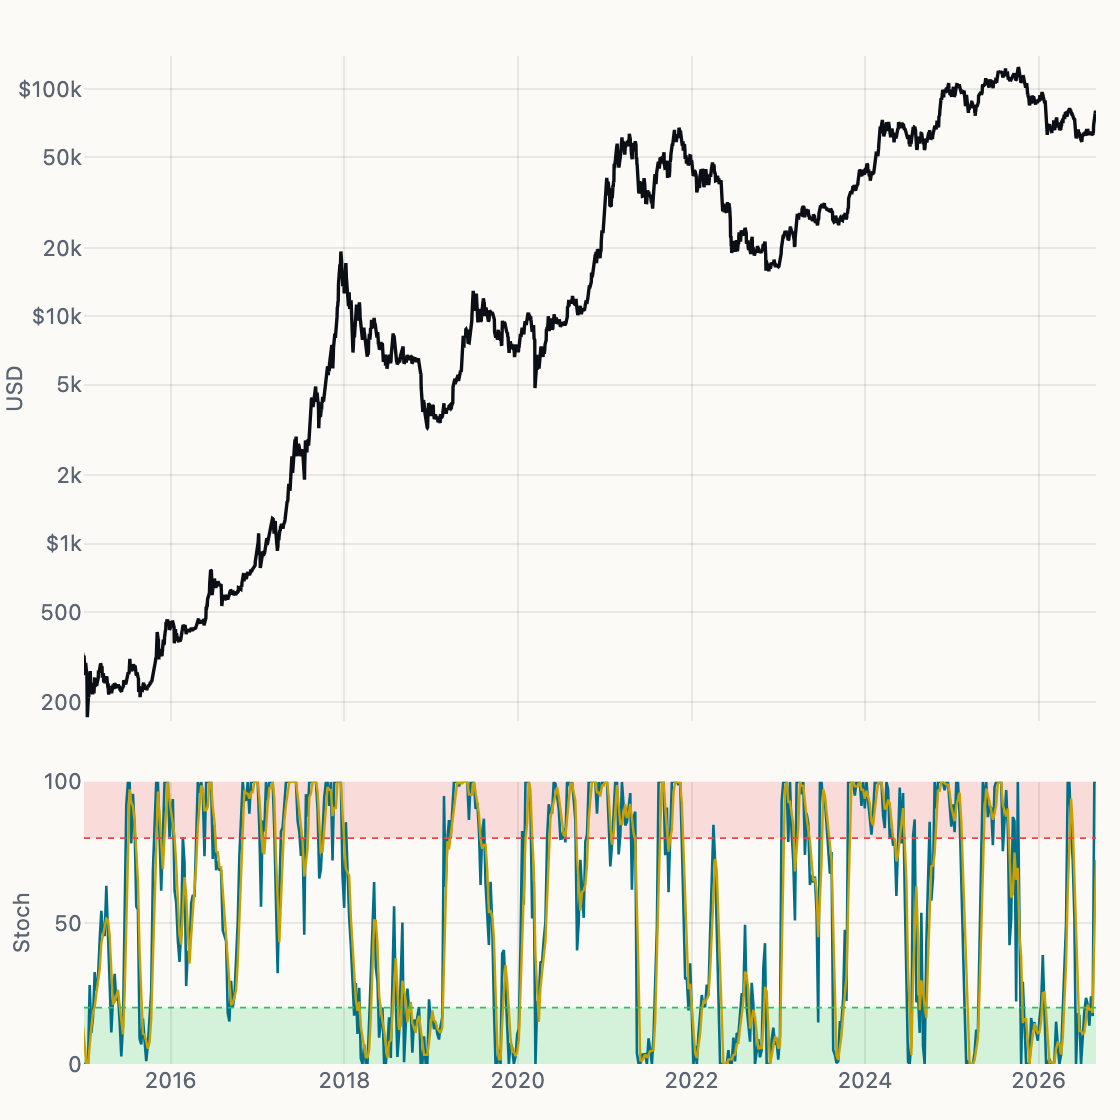
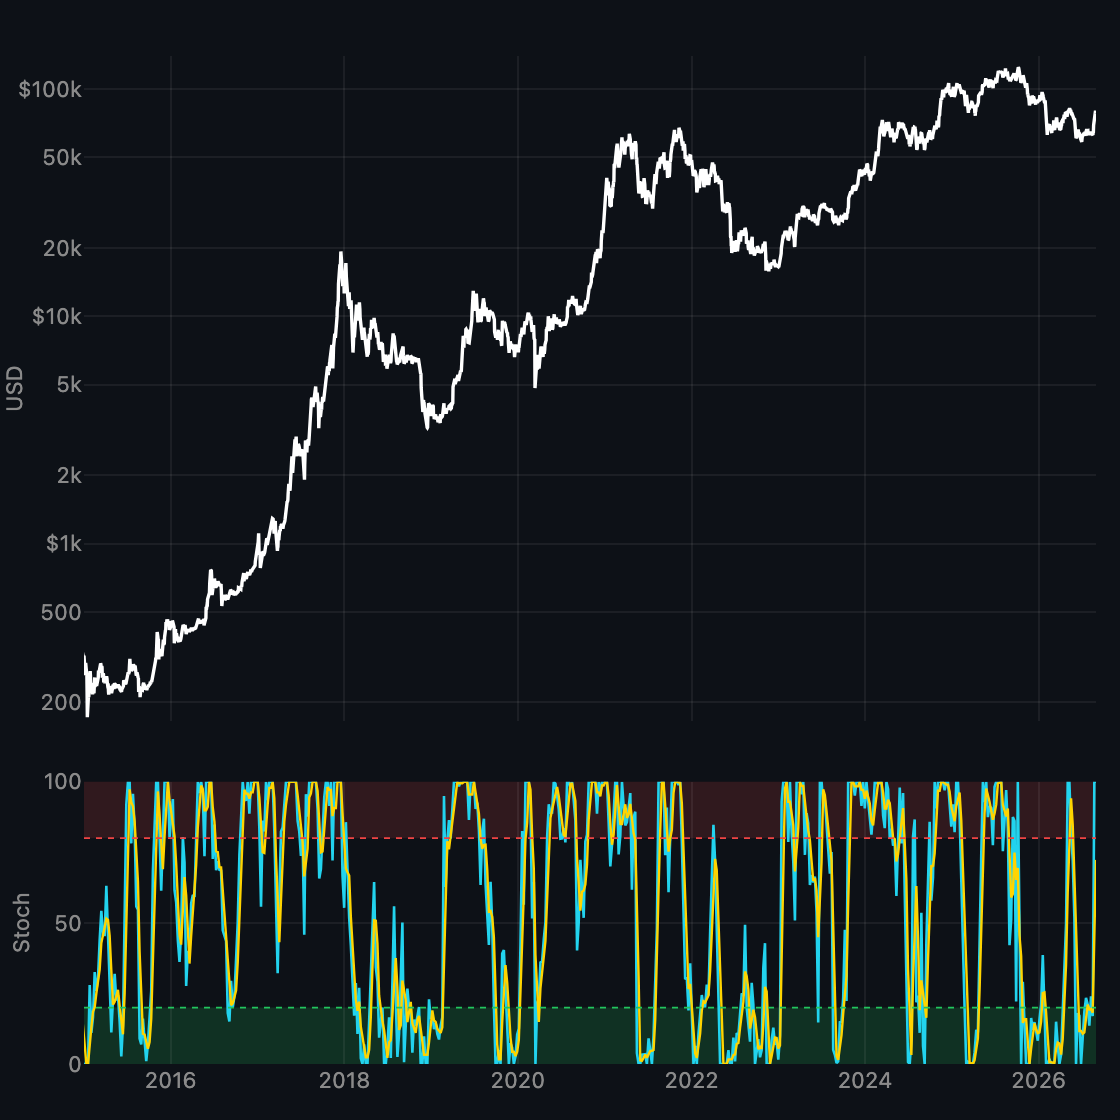
Weekly Stochastic
Stochastic 14/3 on weekly candles.
-
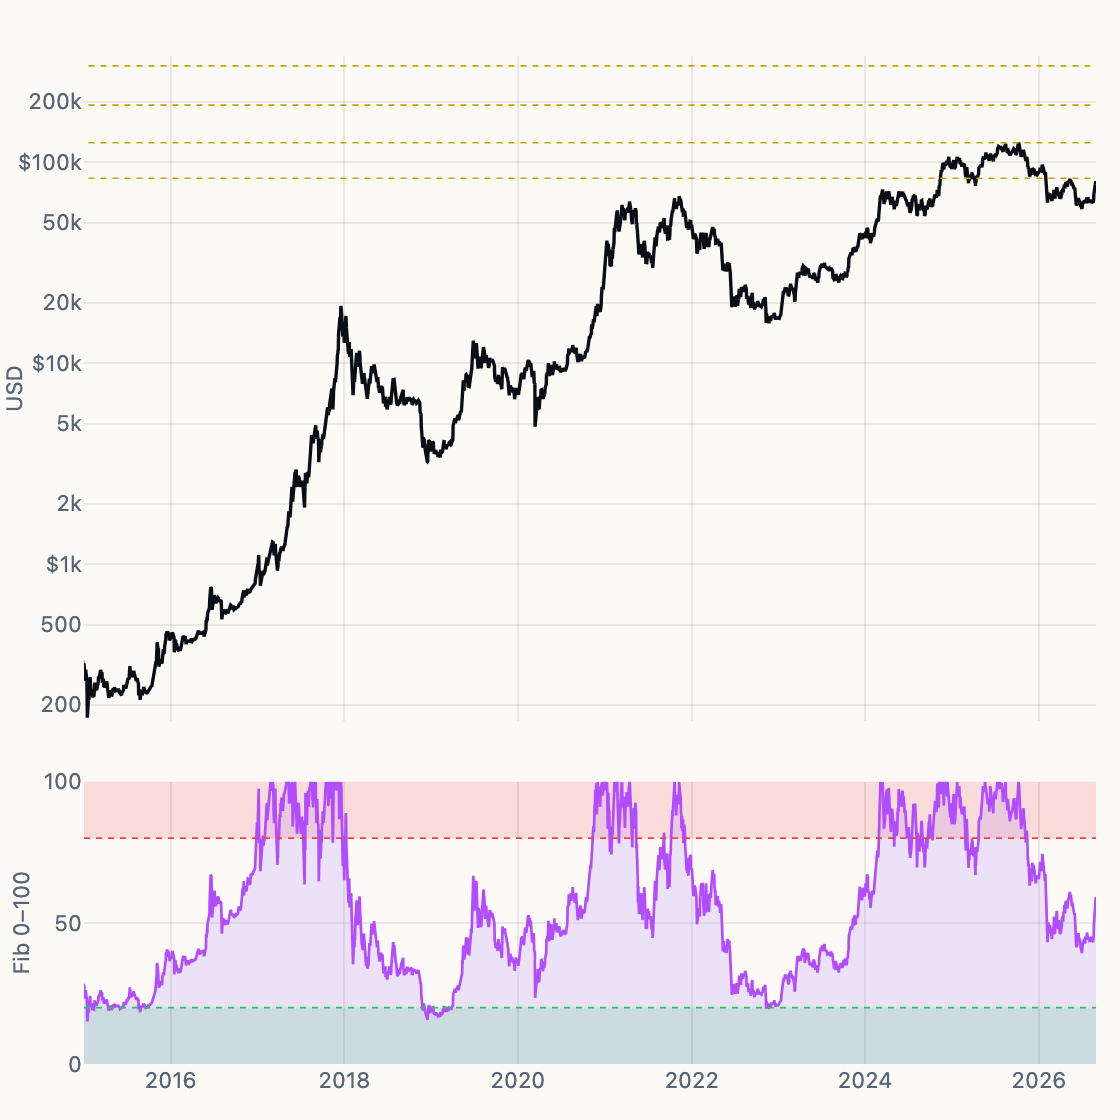
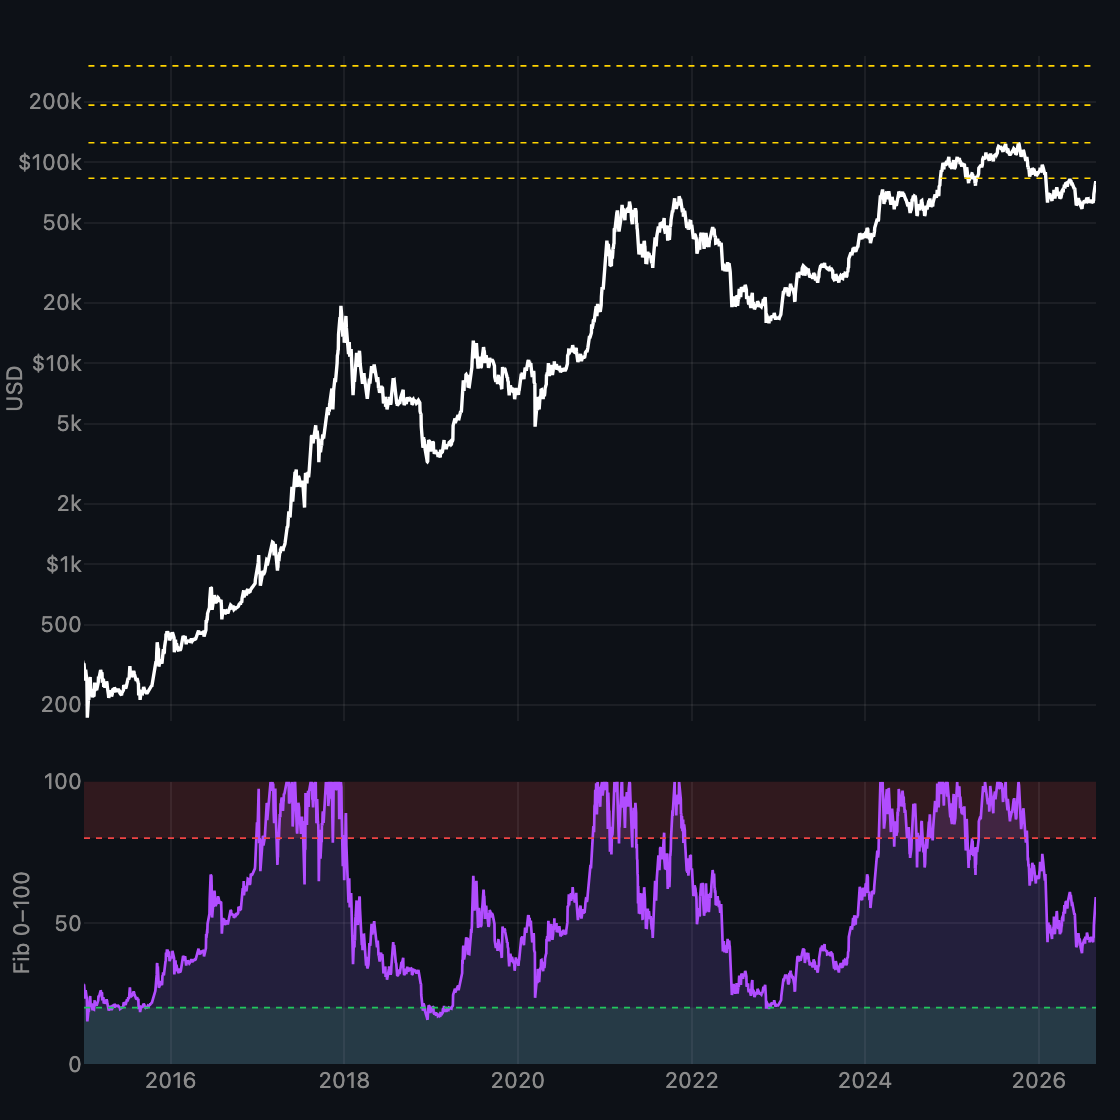
Fibonacci Cycle Zone
0–100 fib retracement inside the multi-year range.
-
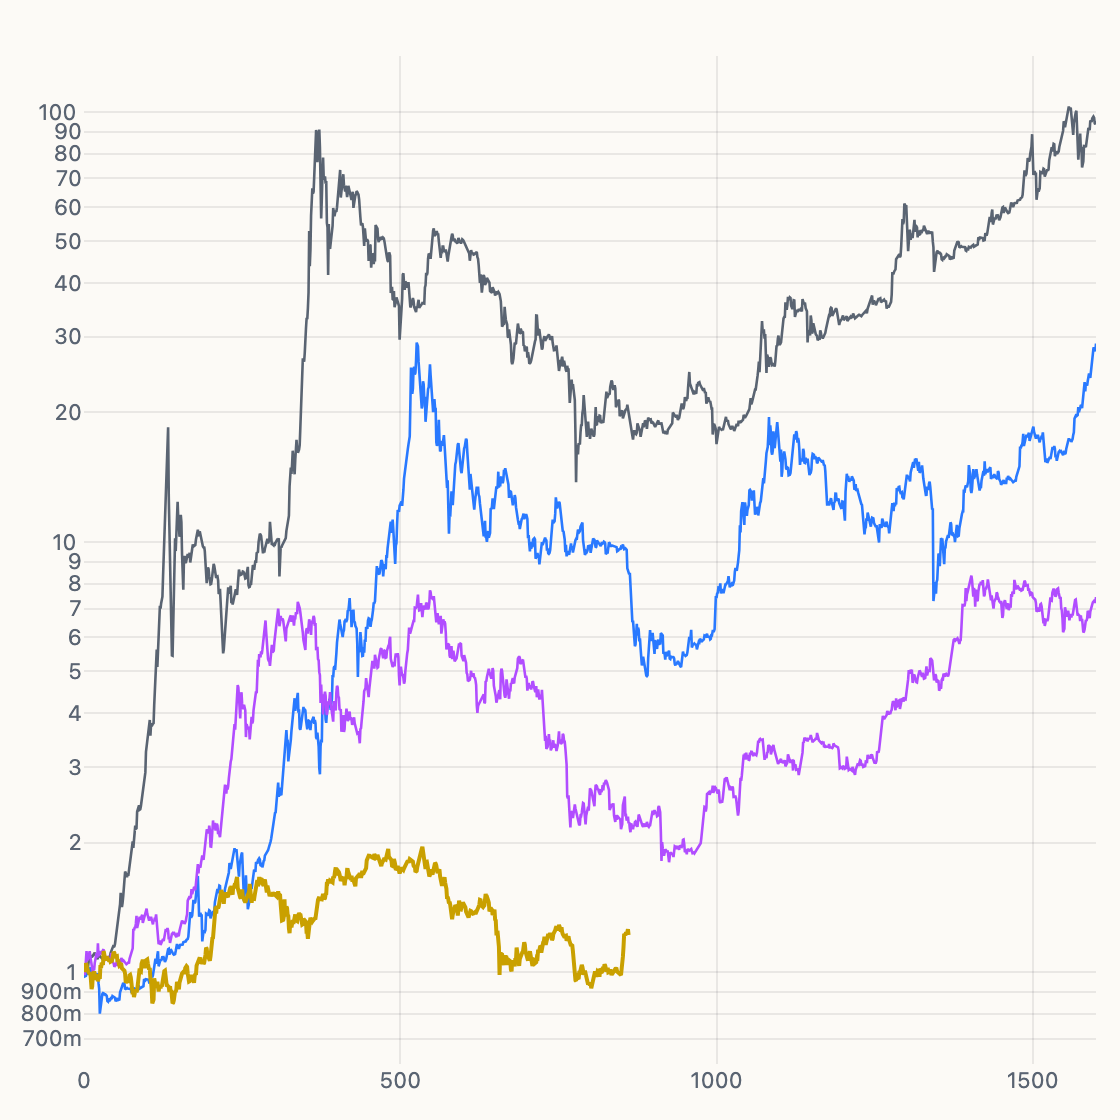
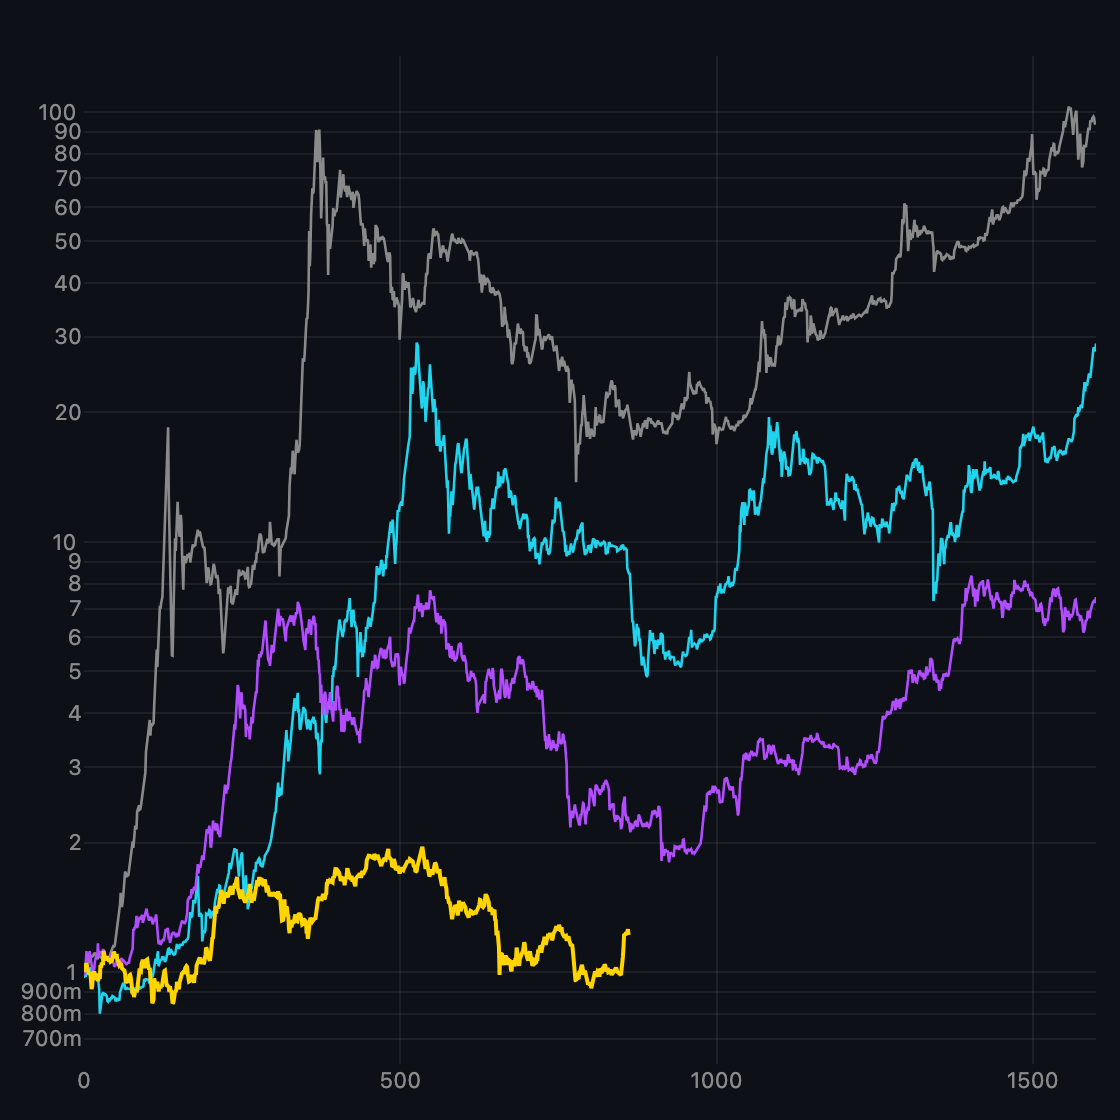
Performance Since Halving
Each cycle indexed to 1× on halving day.
-
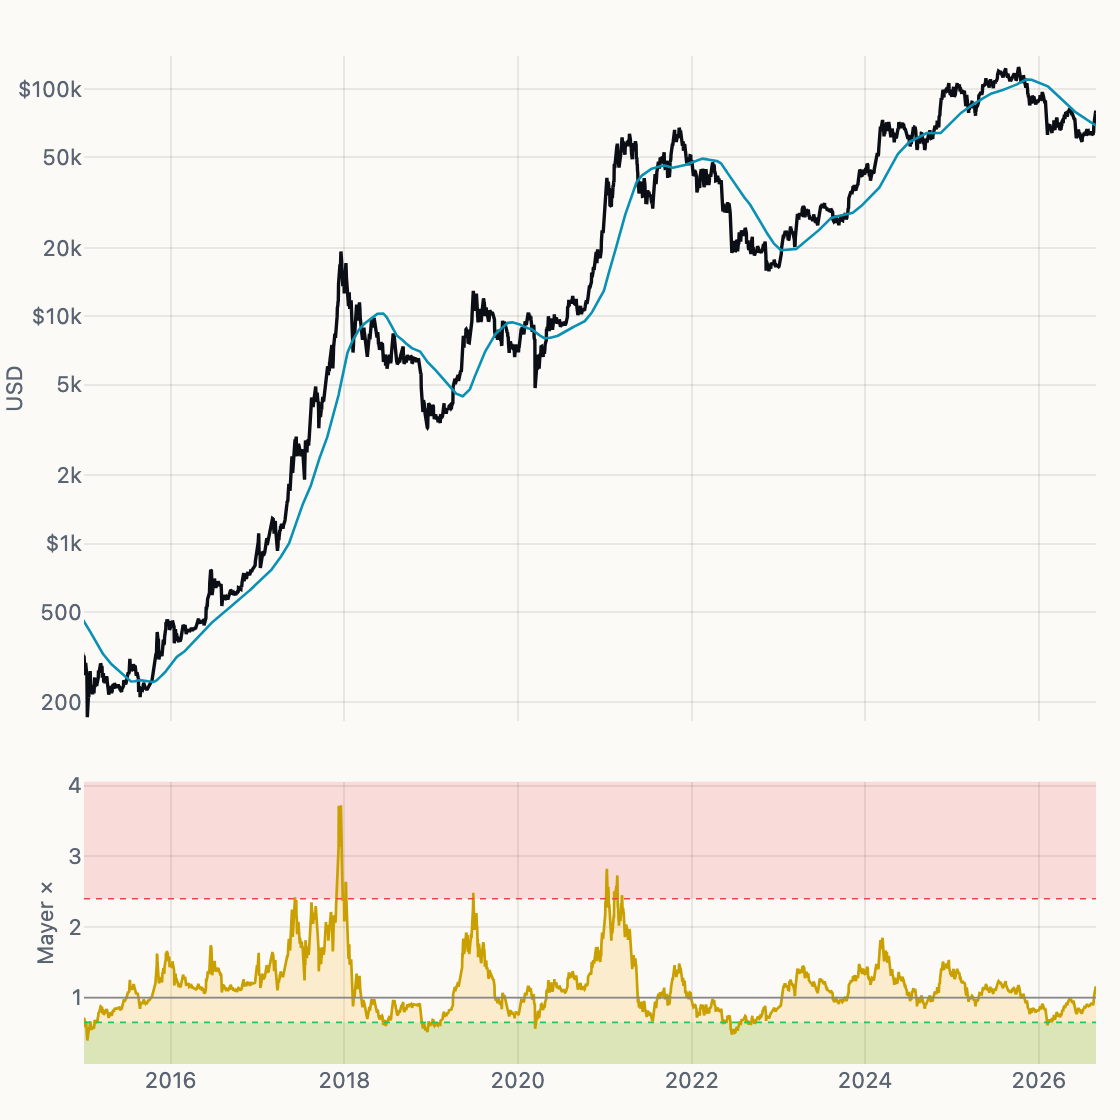
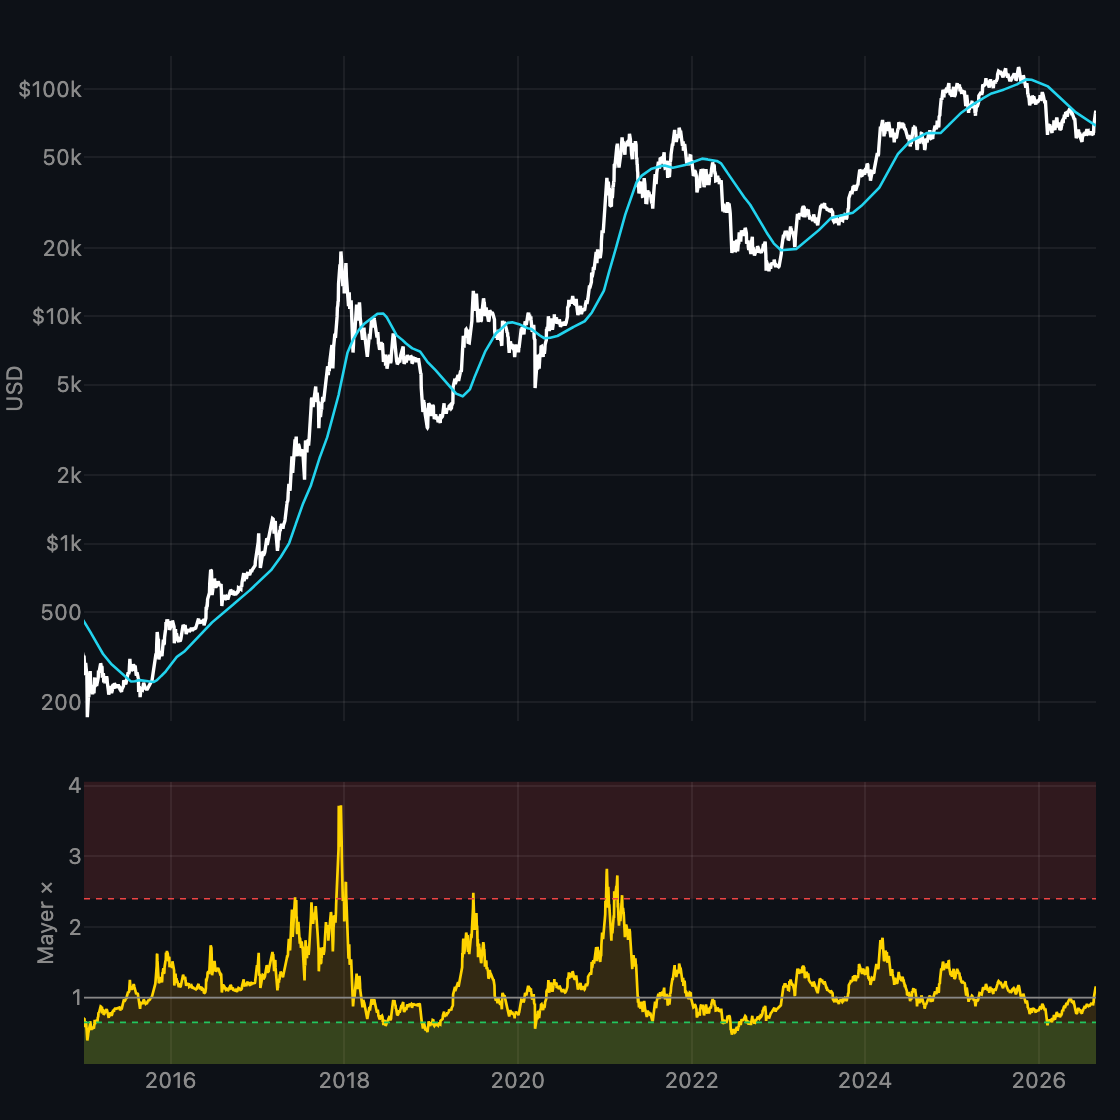
Mayer Multiple
Price ÷ 200-day moving average.
-
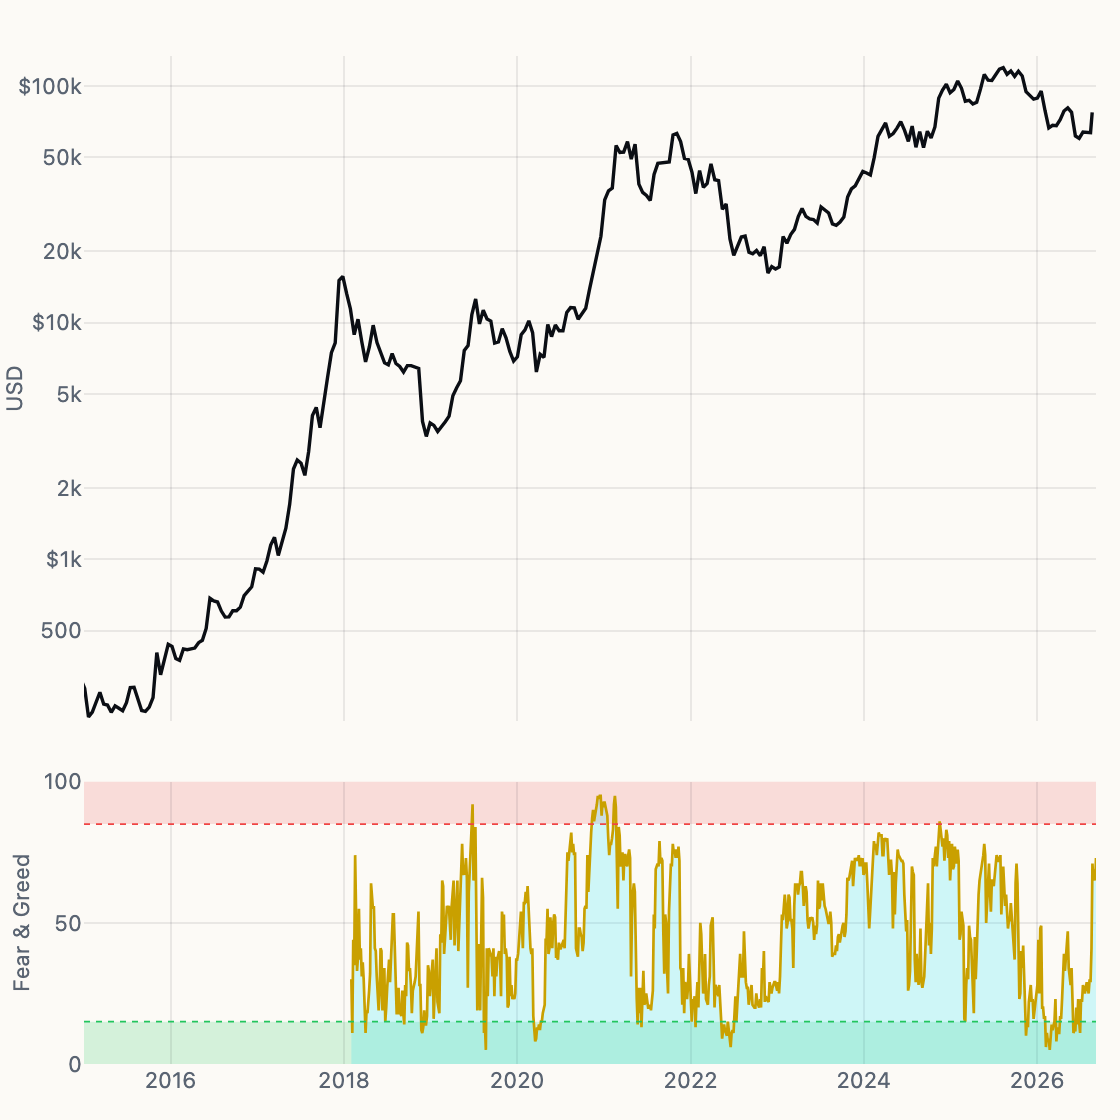
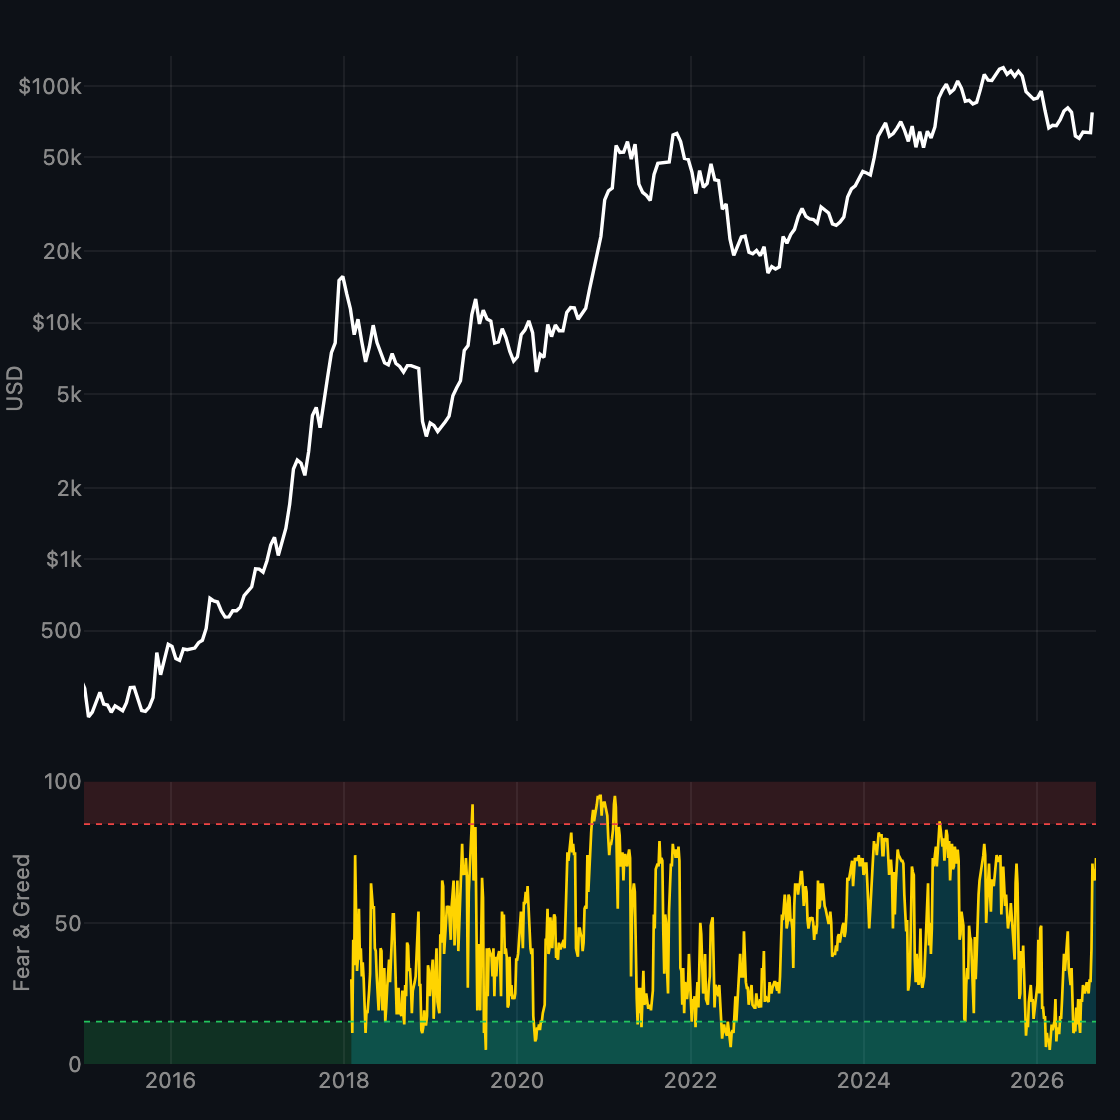
Fear & Greed
Crypto Fear & Greed index vs price.
-
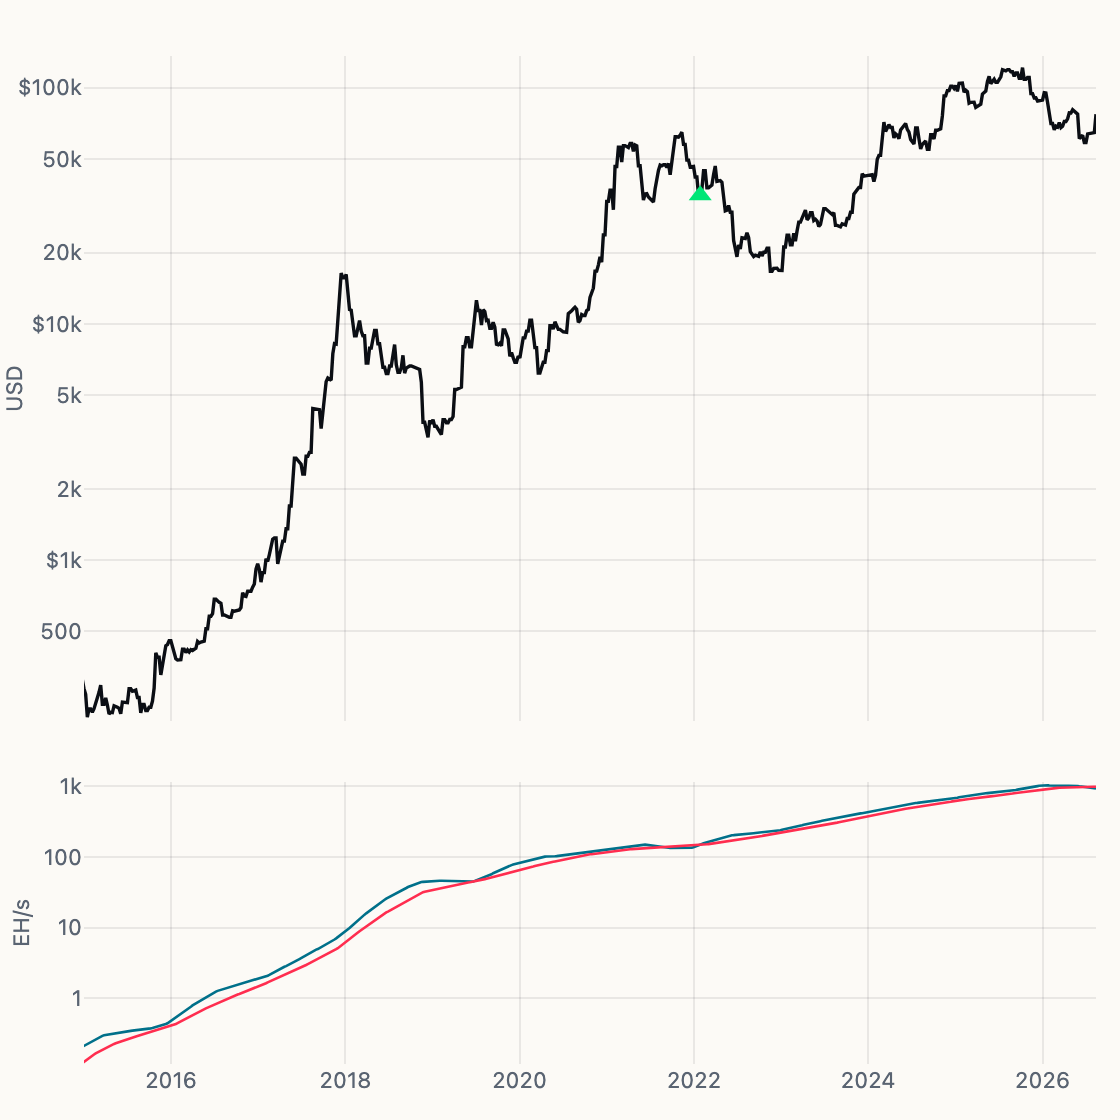
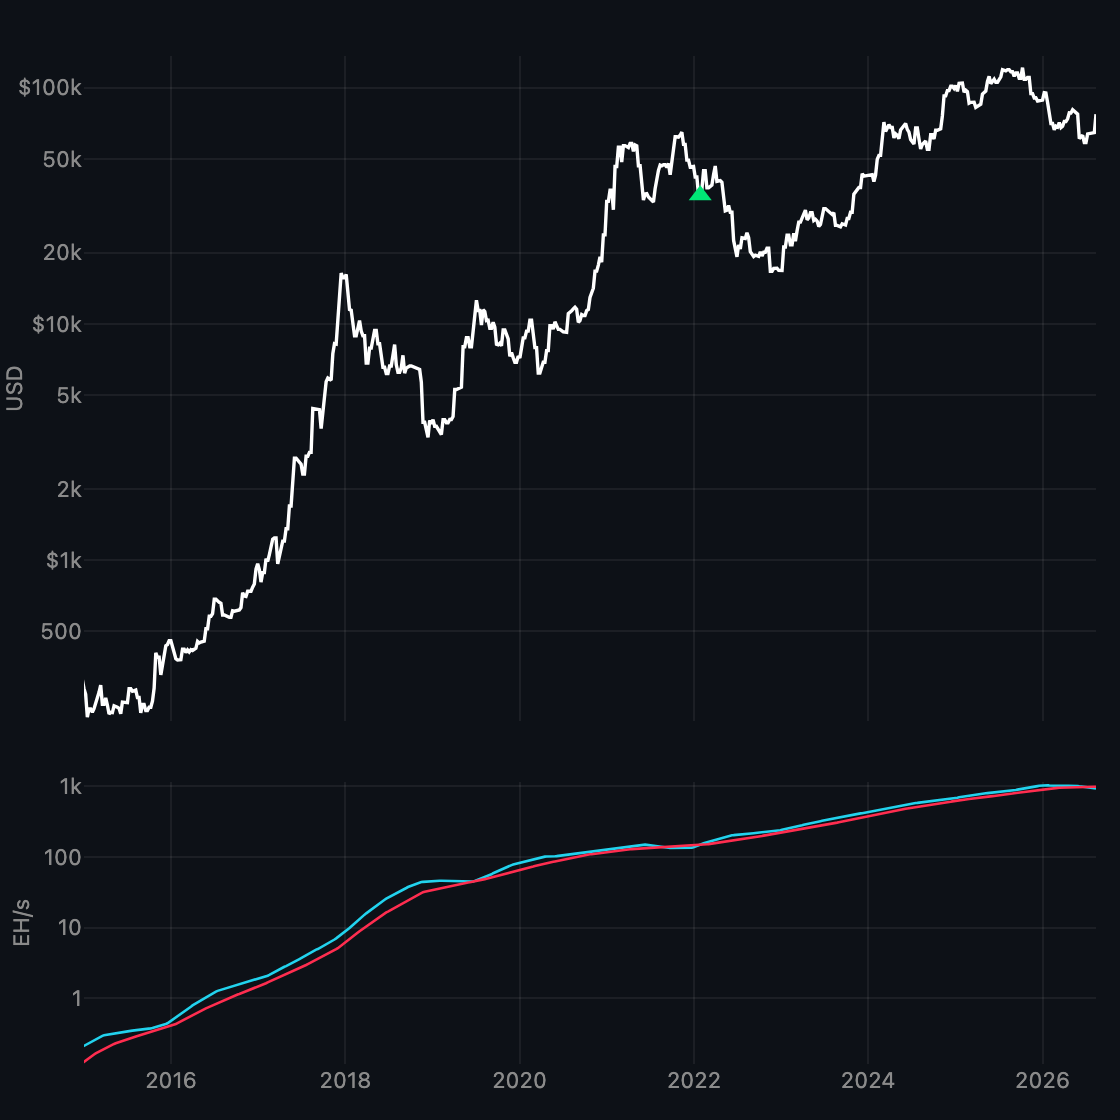
Hash Ribbons
30- vs 60-day hashrate averages and recovery signals.
-
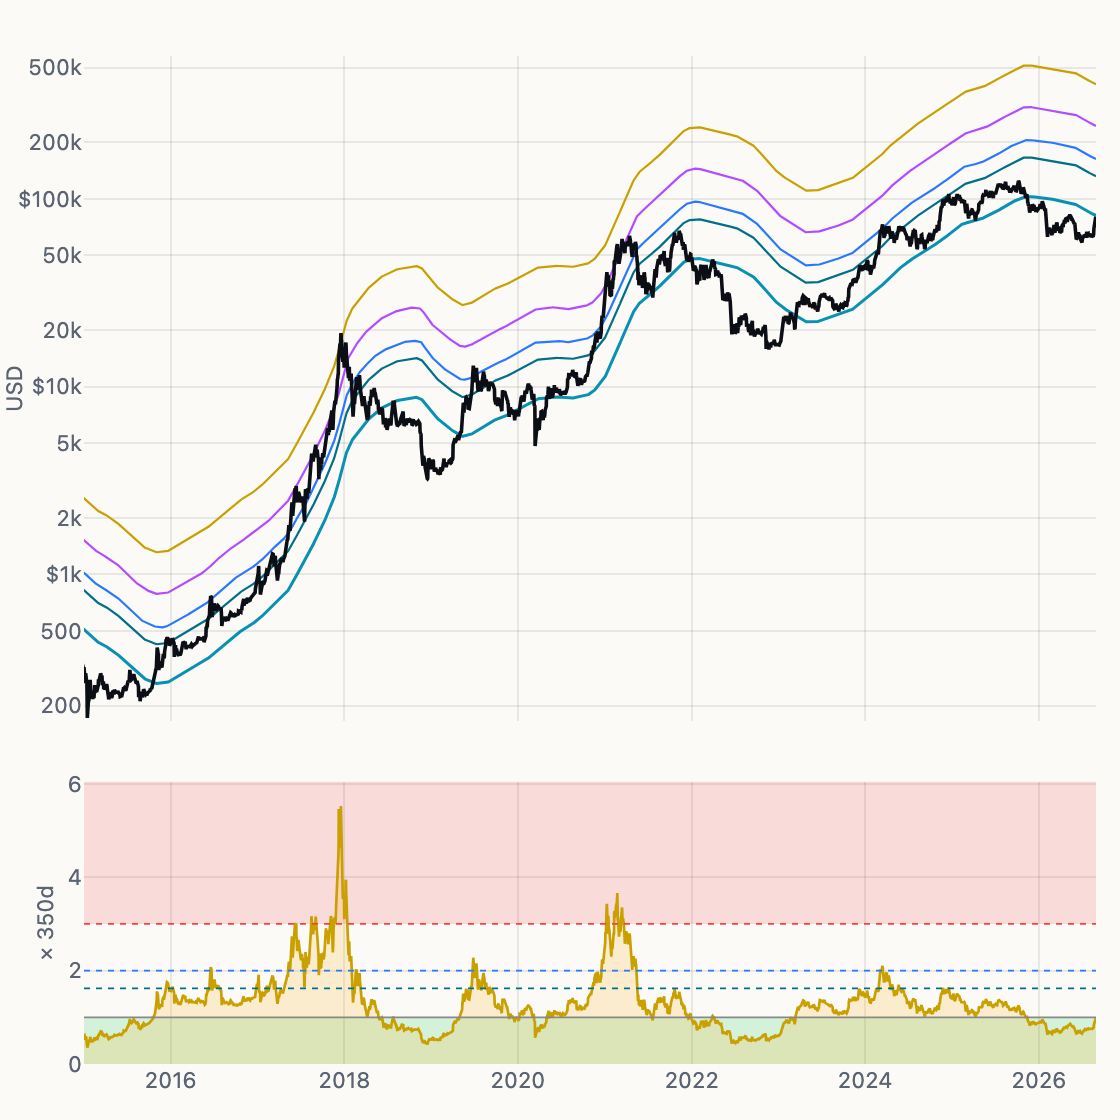
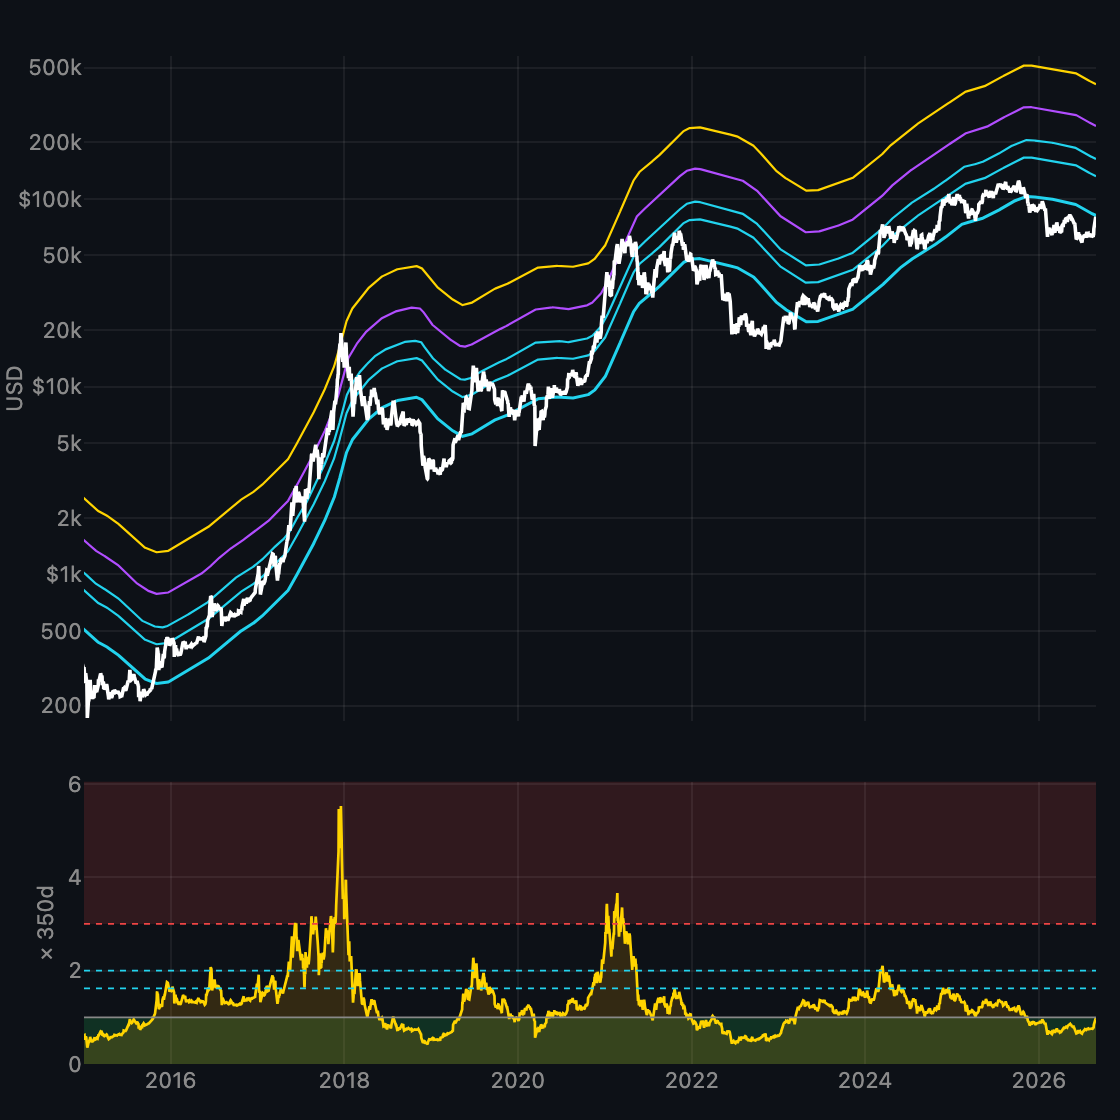
Golden Ratio Multiplier
350-day average × φ and Fibonacci multiples.
-
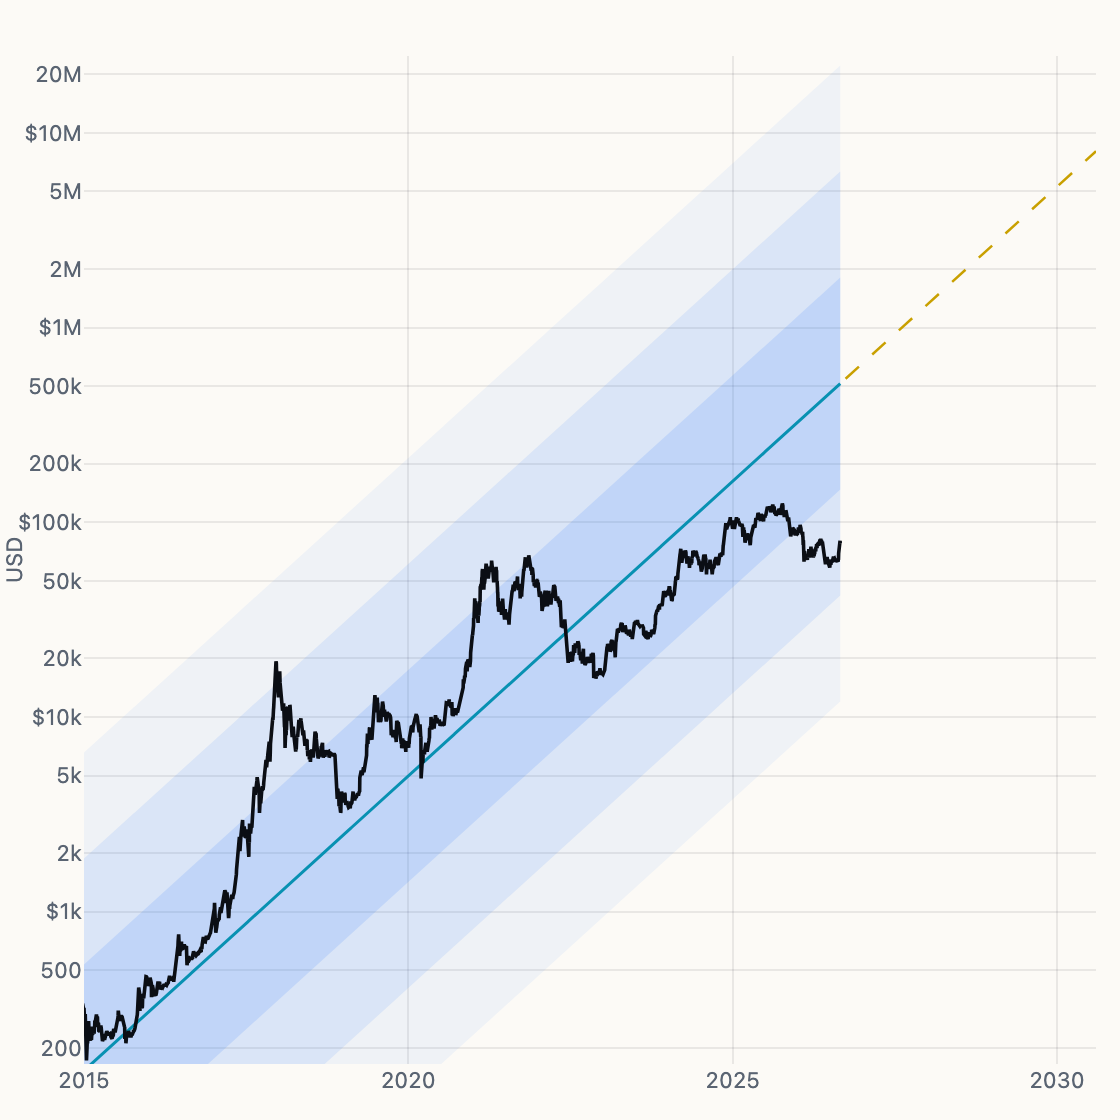
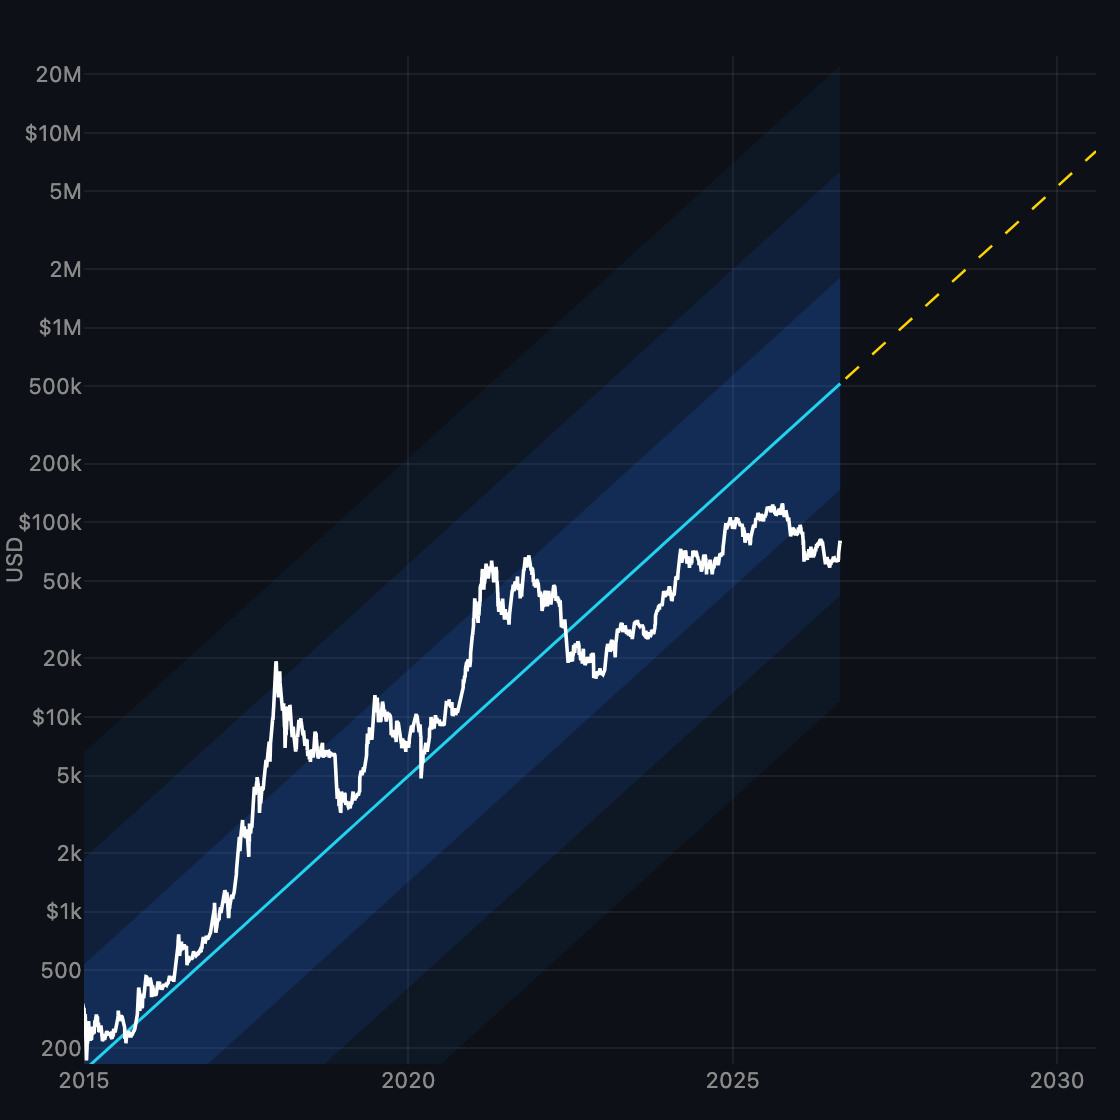
Log-Linear Channel
Log-linear trend with ±1/2/3σ bands.
-
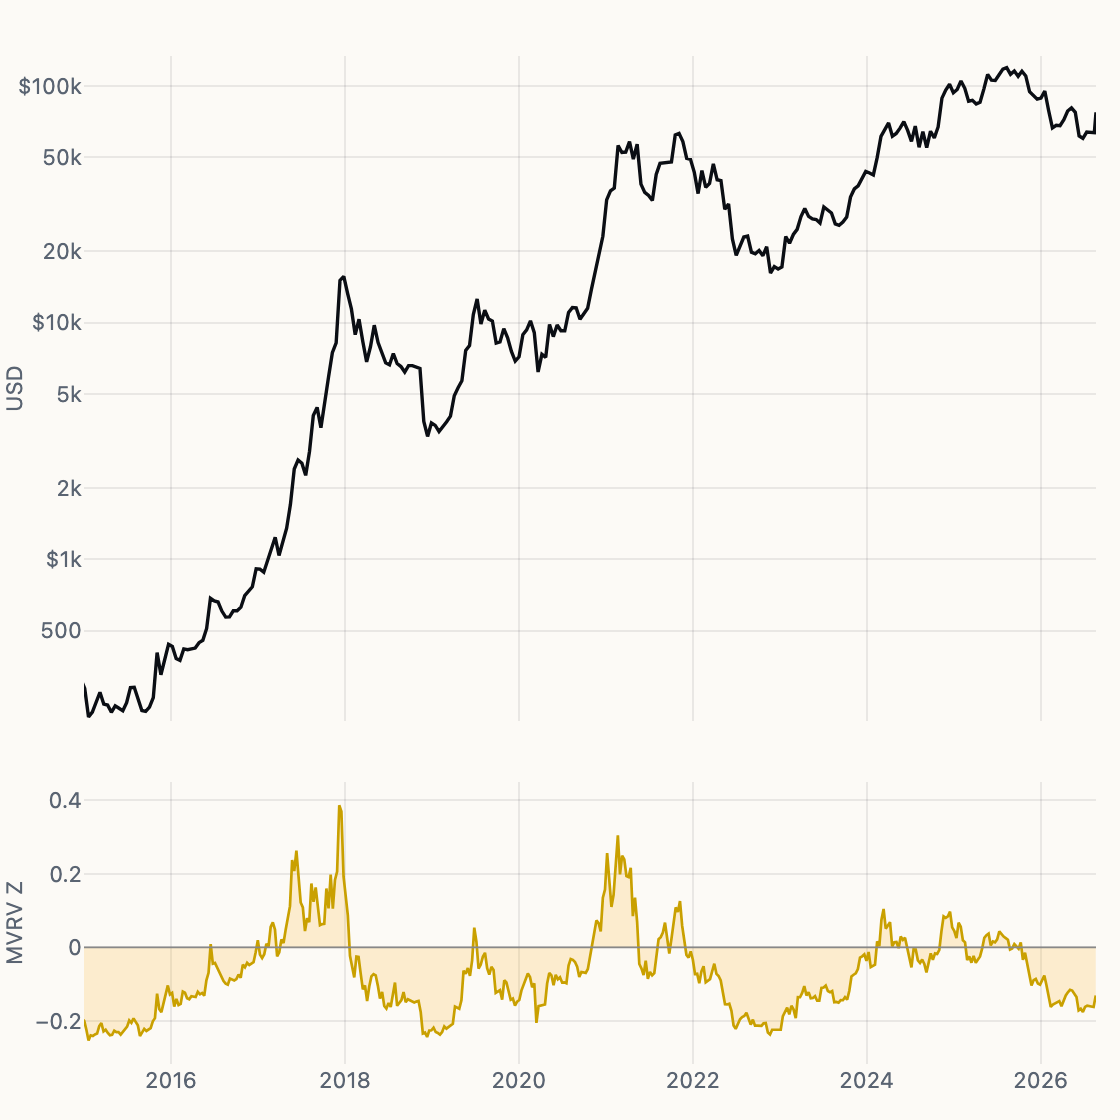
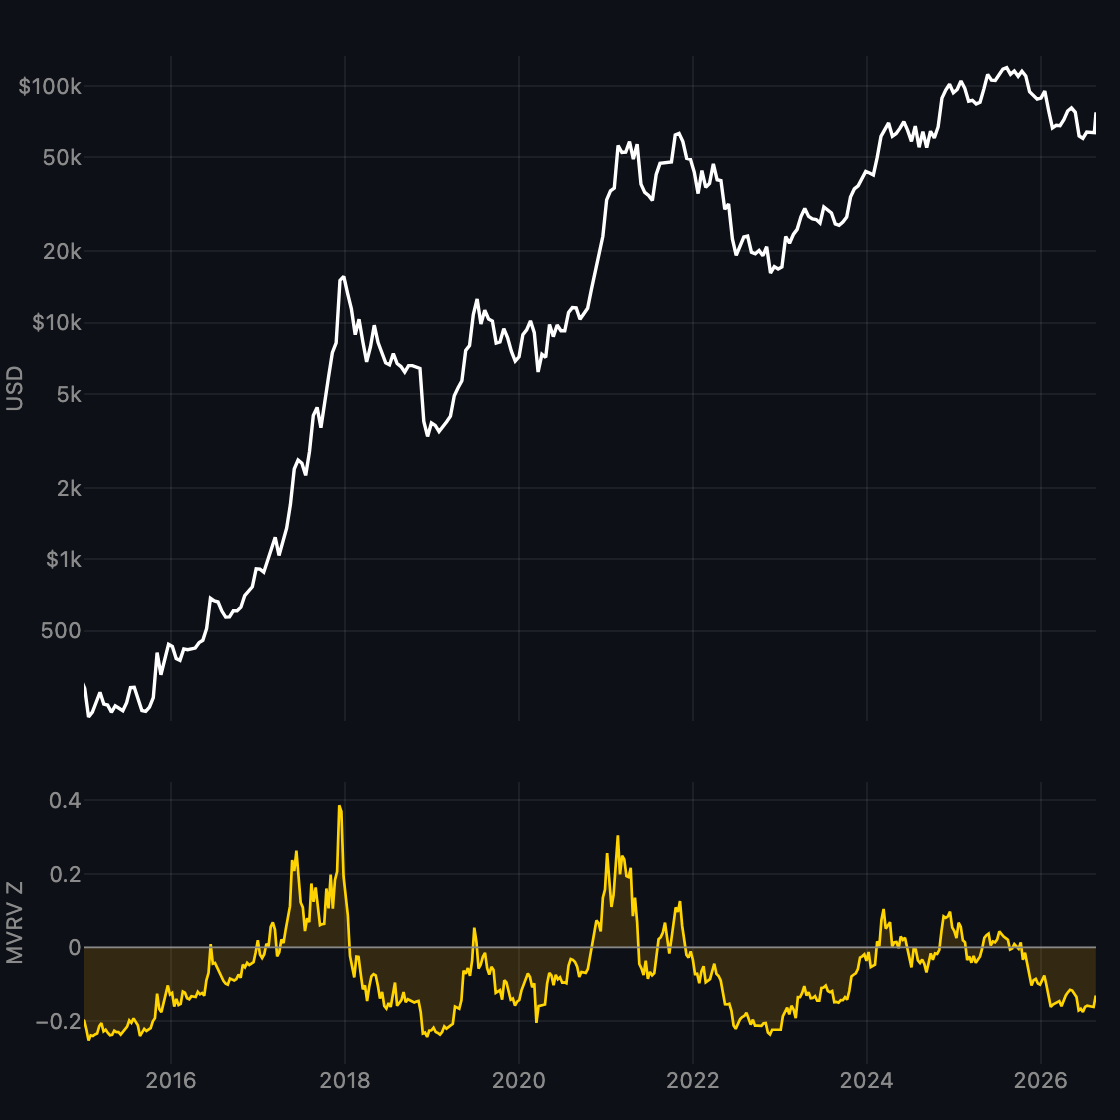
MVRV Z-Score
Market vs realized value in standard deviations.
-
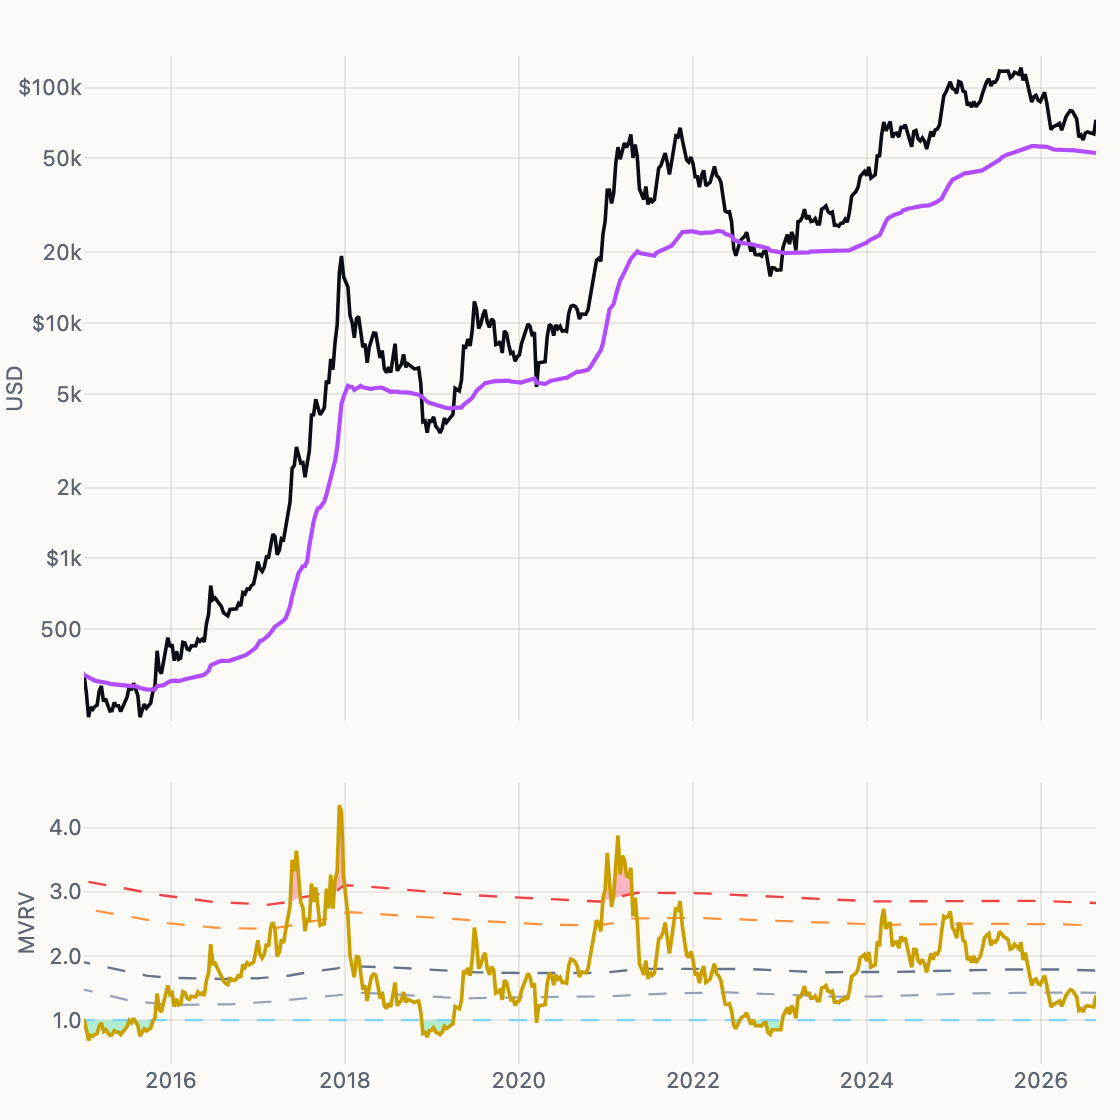
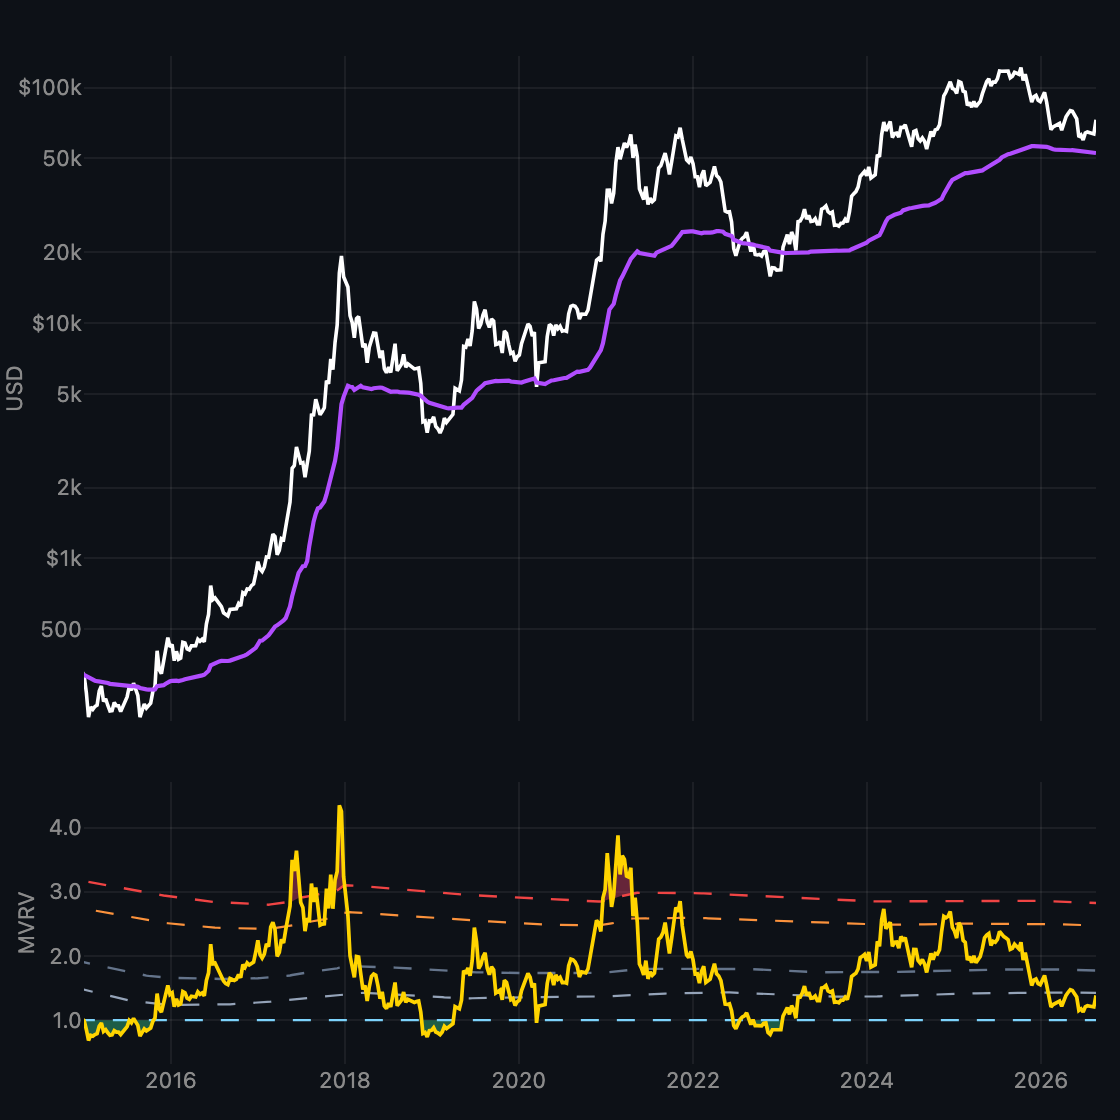
The MVRV Ratio
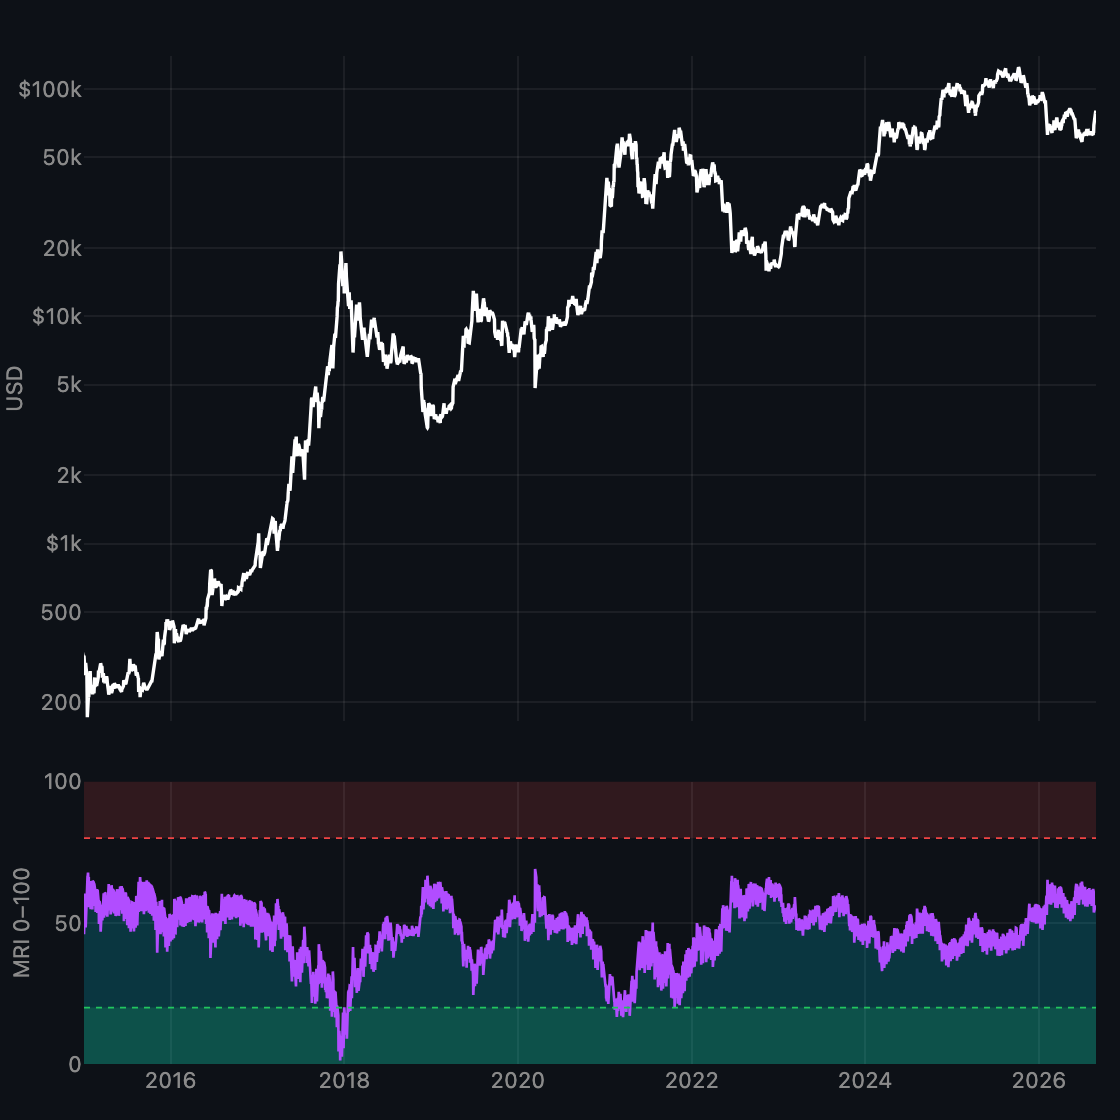
Log price and realized cost basis on top, MVRV with expanding mean ± σ below. Green under 1, red above +1.5σ.
-
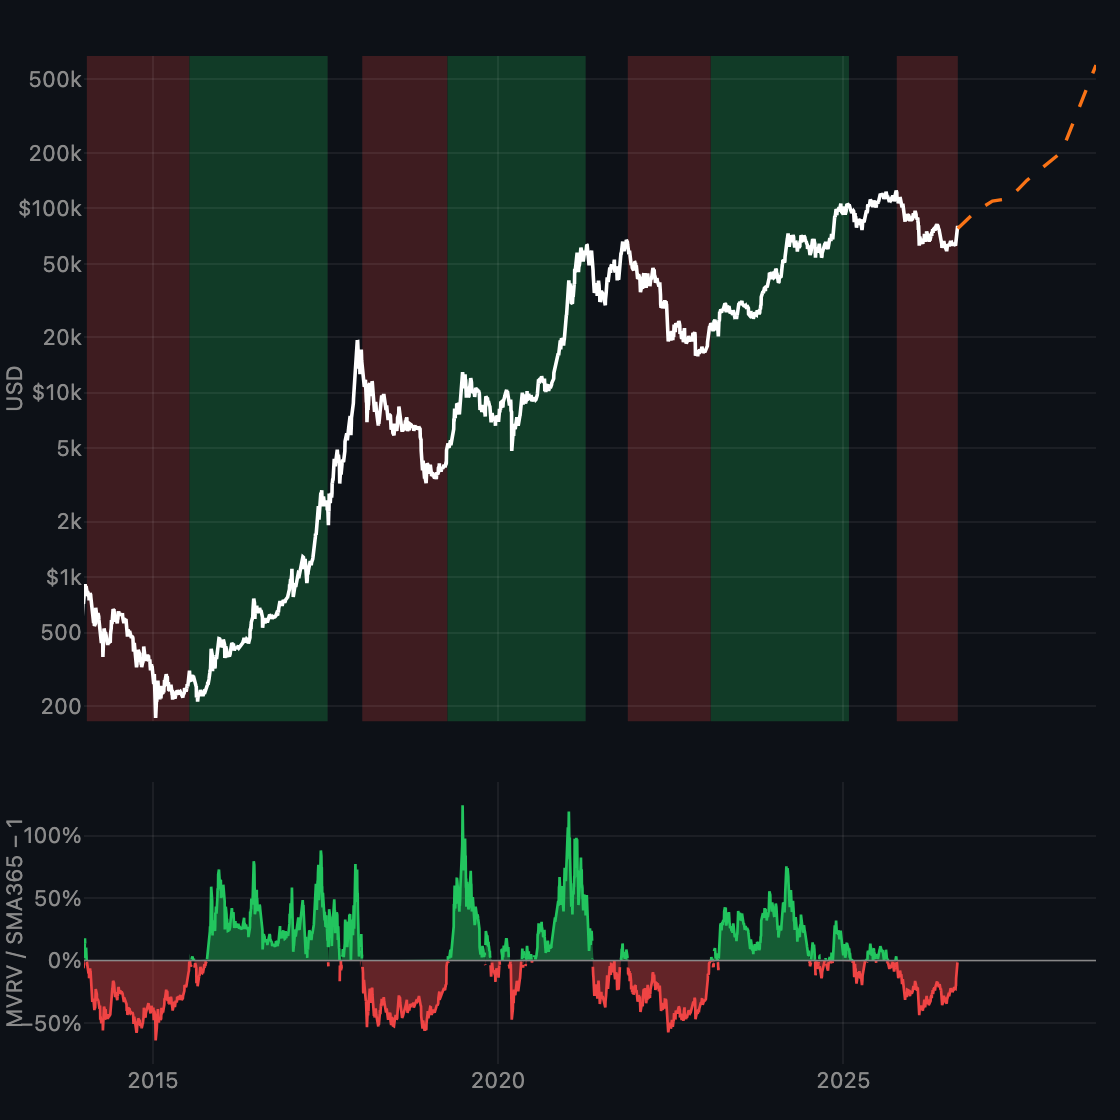
MVRV Momentum Oscillator
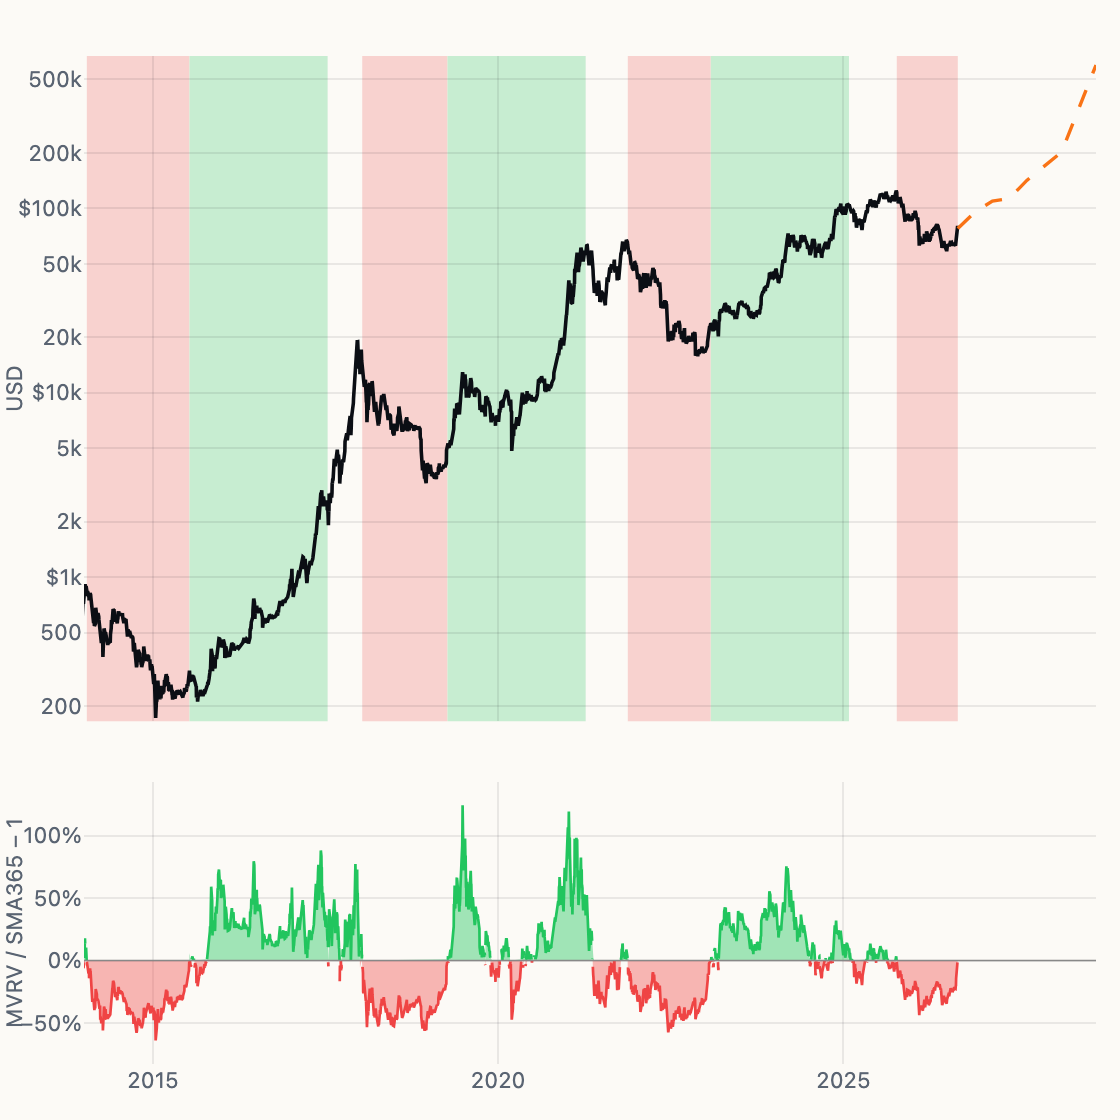
MVRV versus its own 365-day average. Red on price is a 320+ day stretch below zero; green is the 24 months after the flip, with the median path of prior flips drawn forward.
-
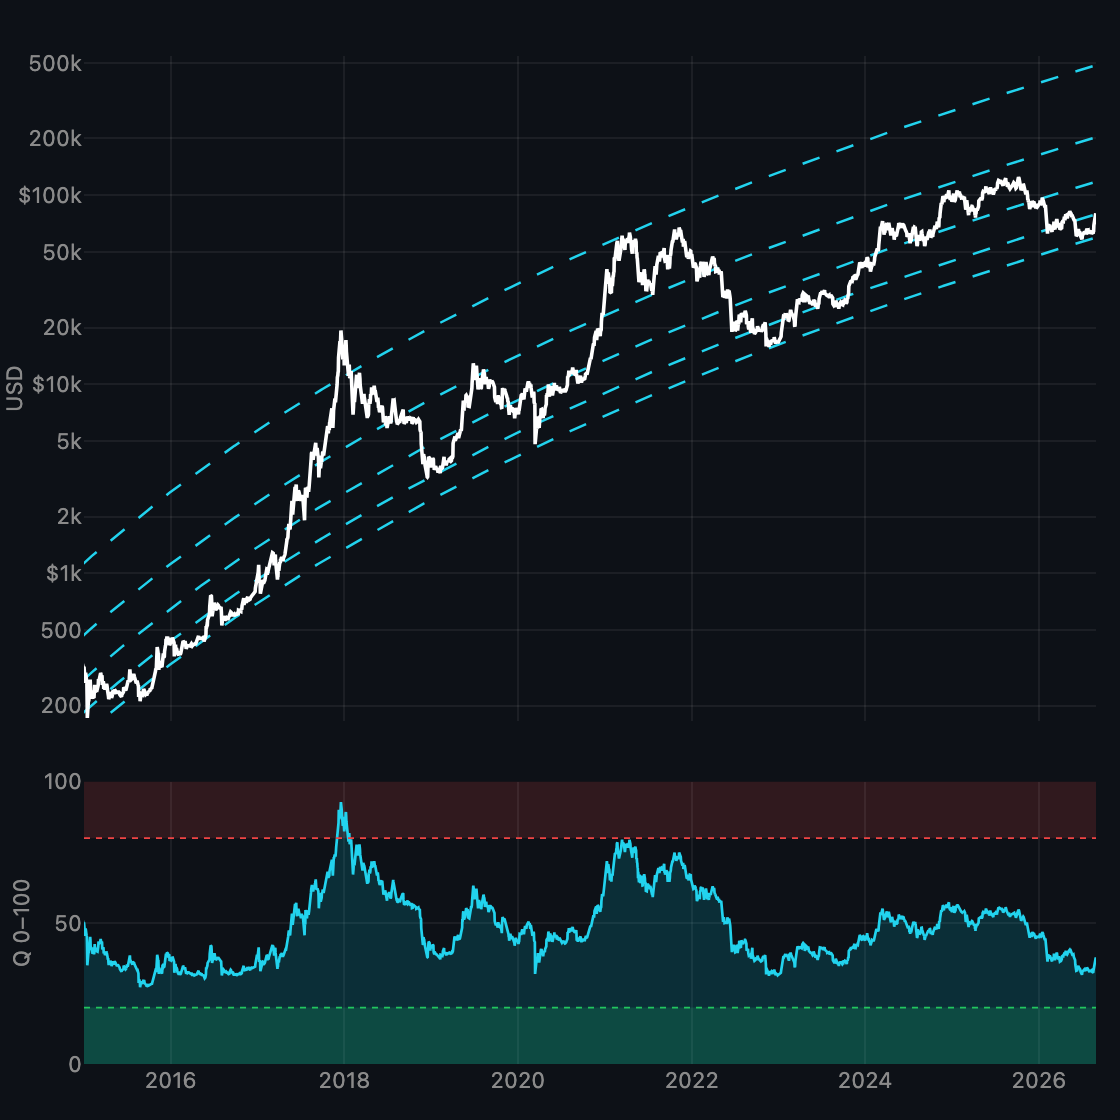
Residual Quantiles
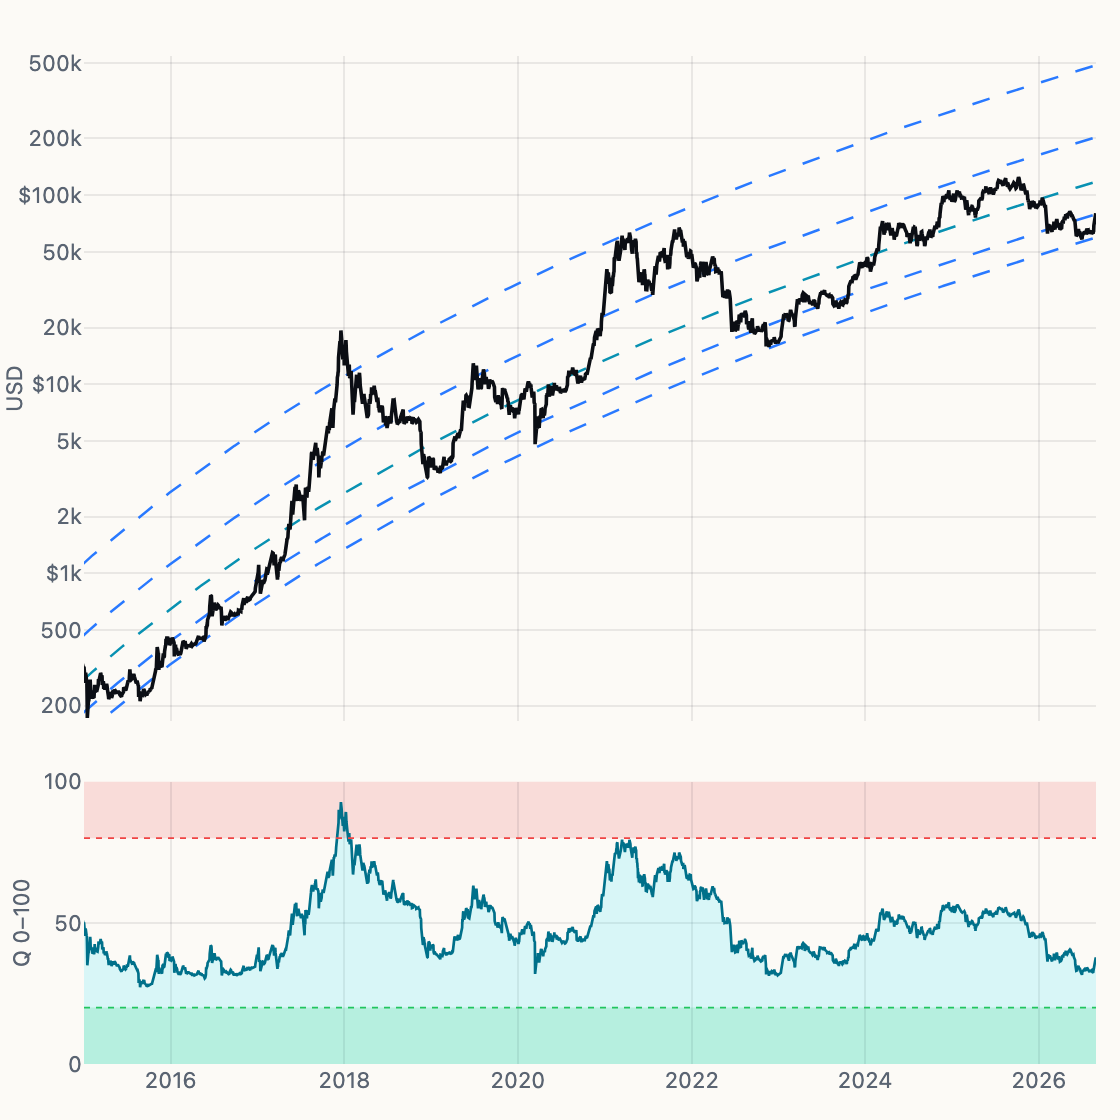
Power-law trend with empirical Q5–Q95 residual bands.
-
Fair-Value Residual
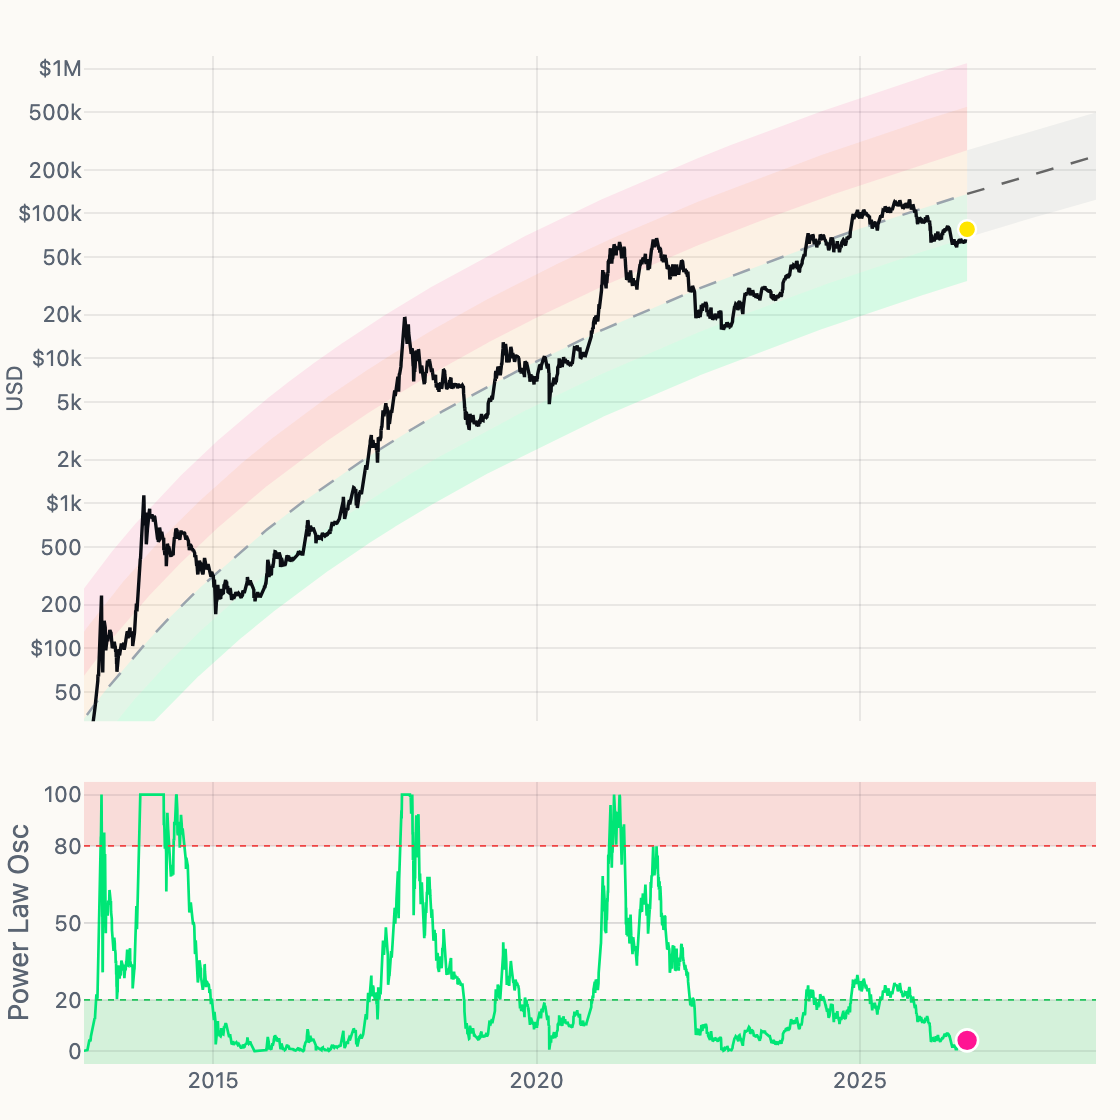
Fair value with ±1/2/3σ bands and a 2-year projection, paired with a percentile oscillator and historical 1-year forward returns by deviation zone.
-
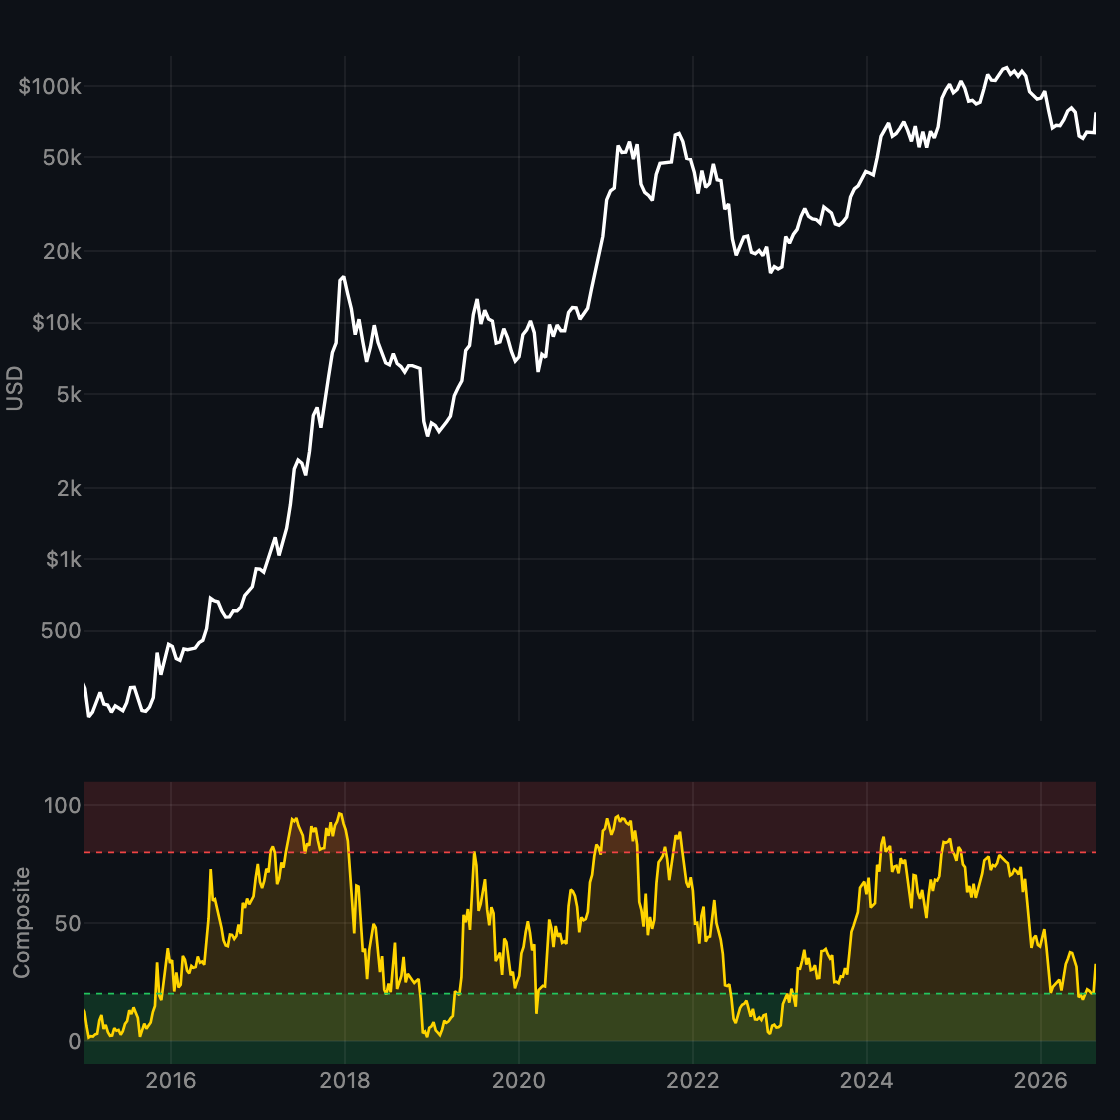
MVRV–NUPL Composite
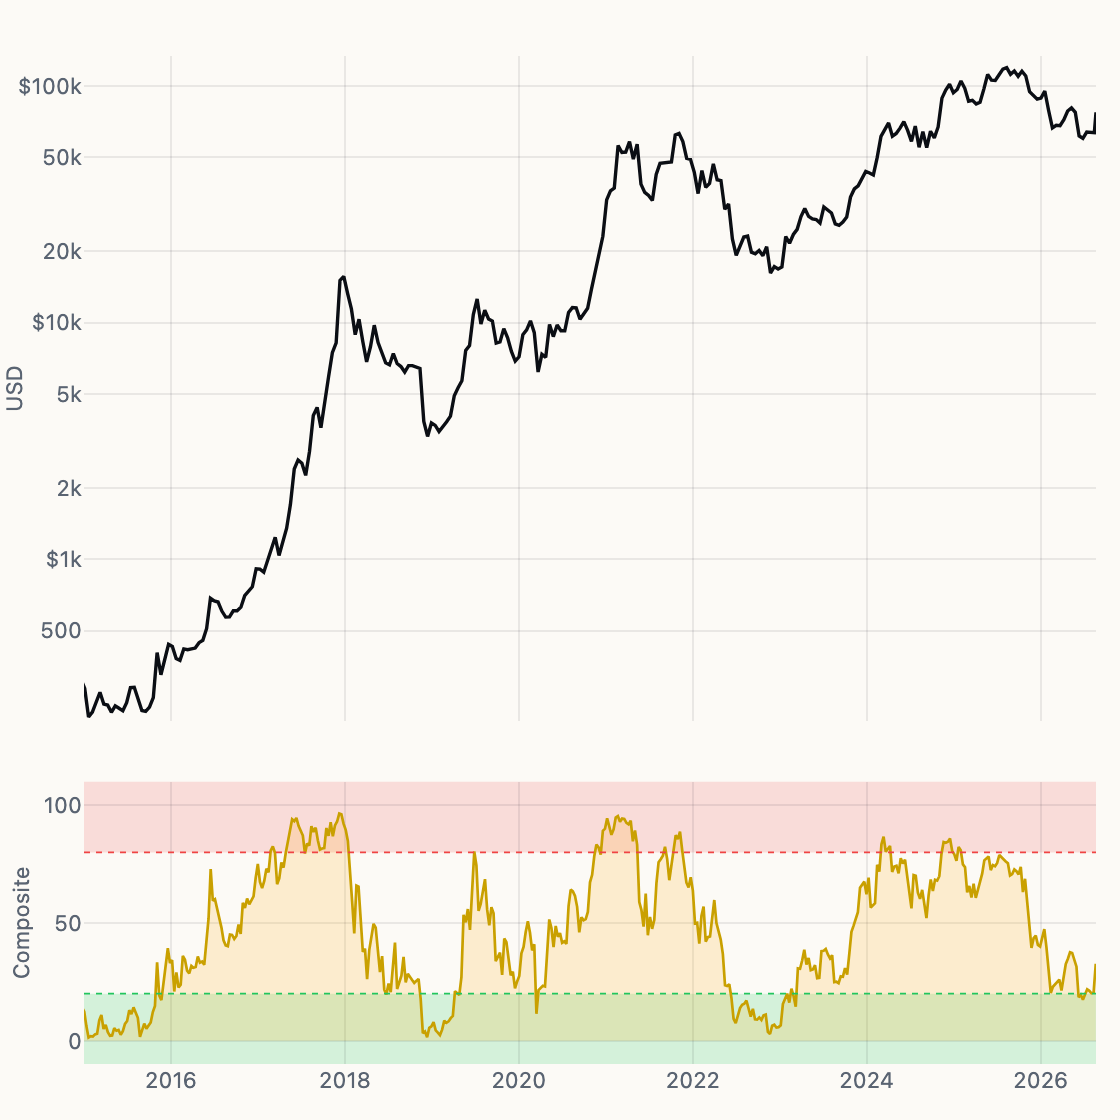
Ranked blend of MVRV and NUPL into 0–100.
-
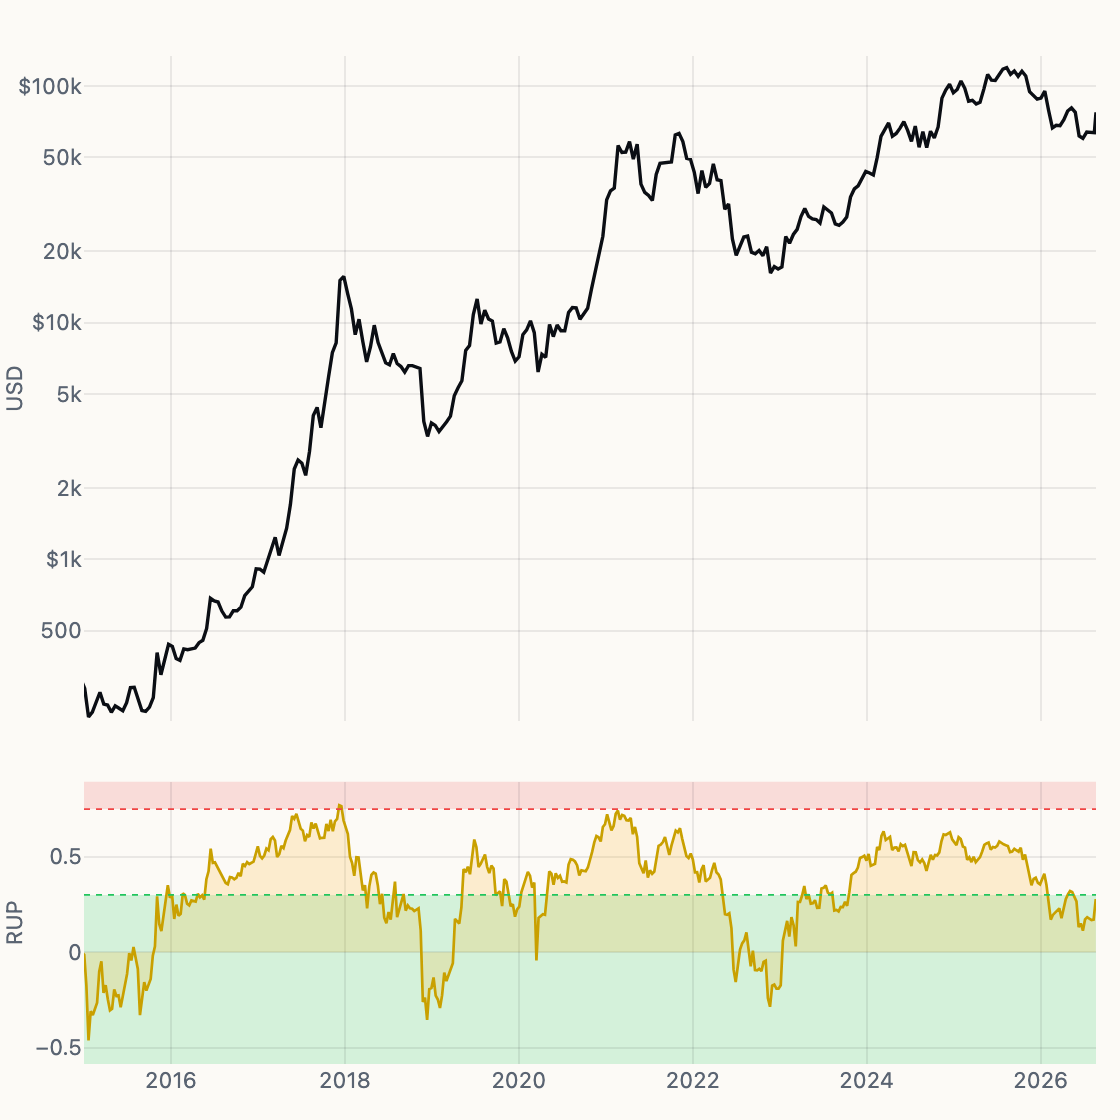
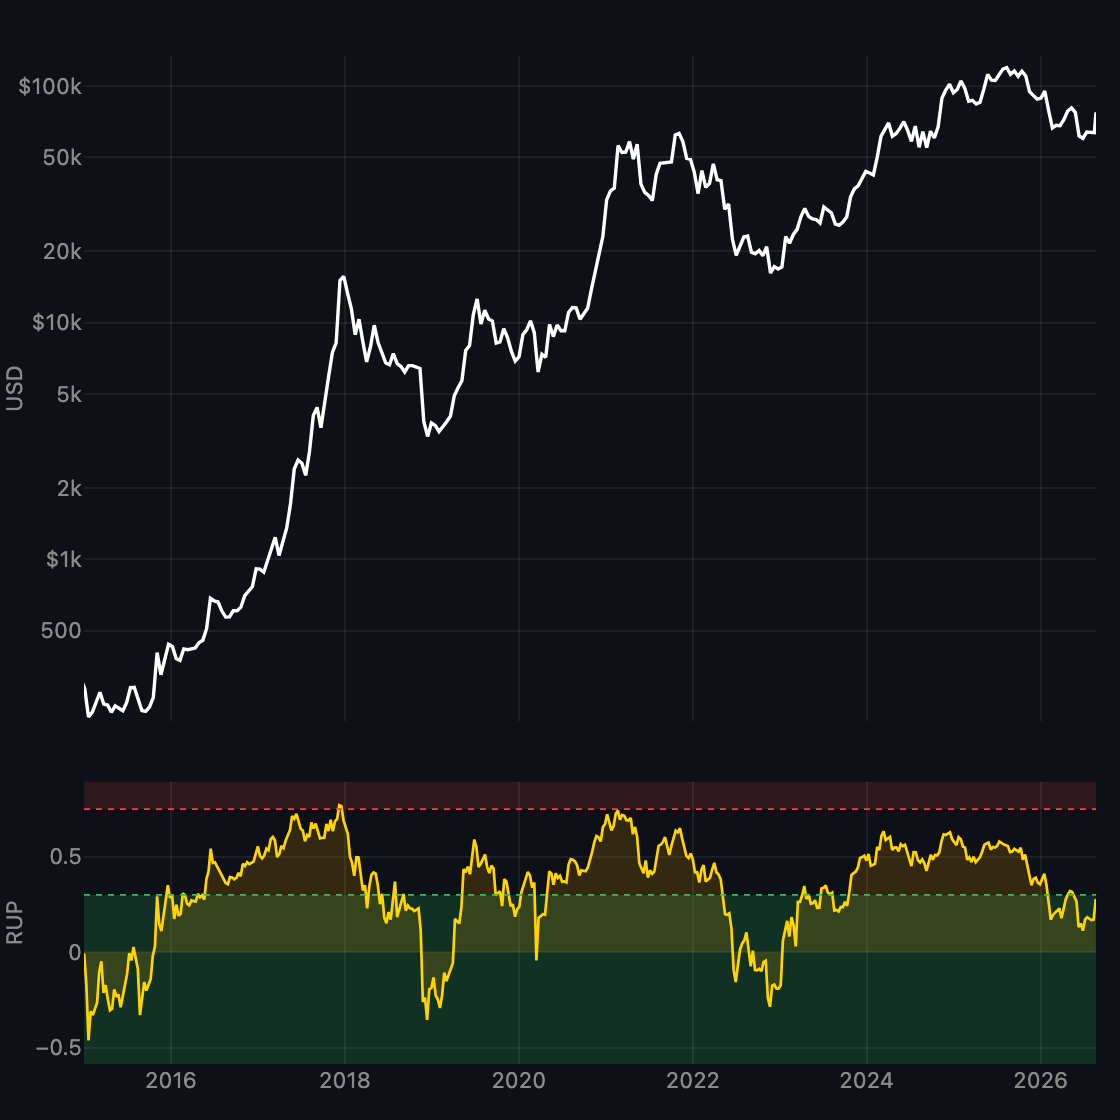
Relative Unrealized Profit
Paper profit as a share of market cap.
-
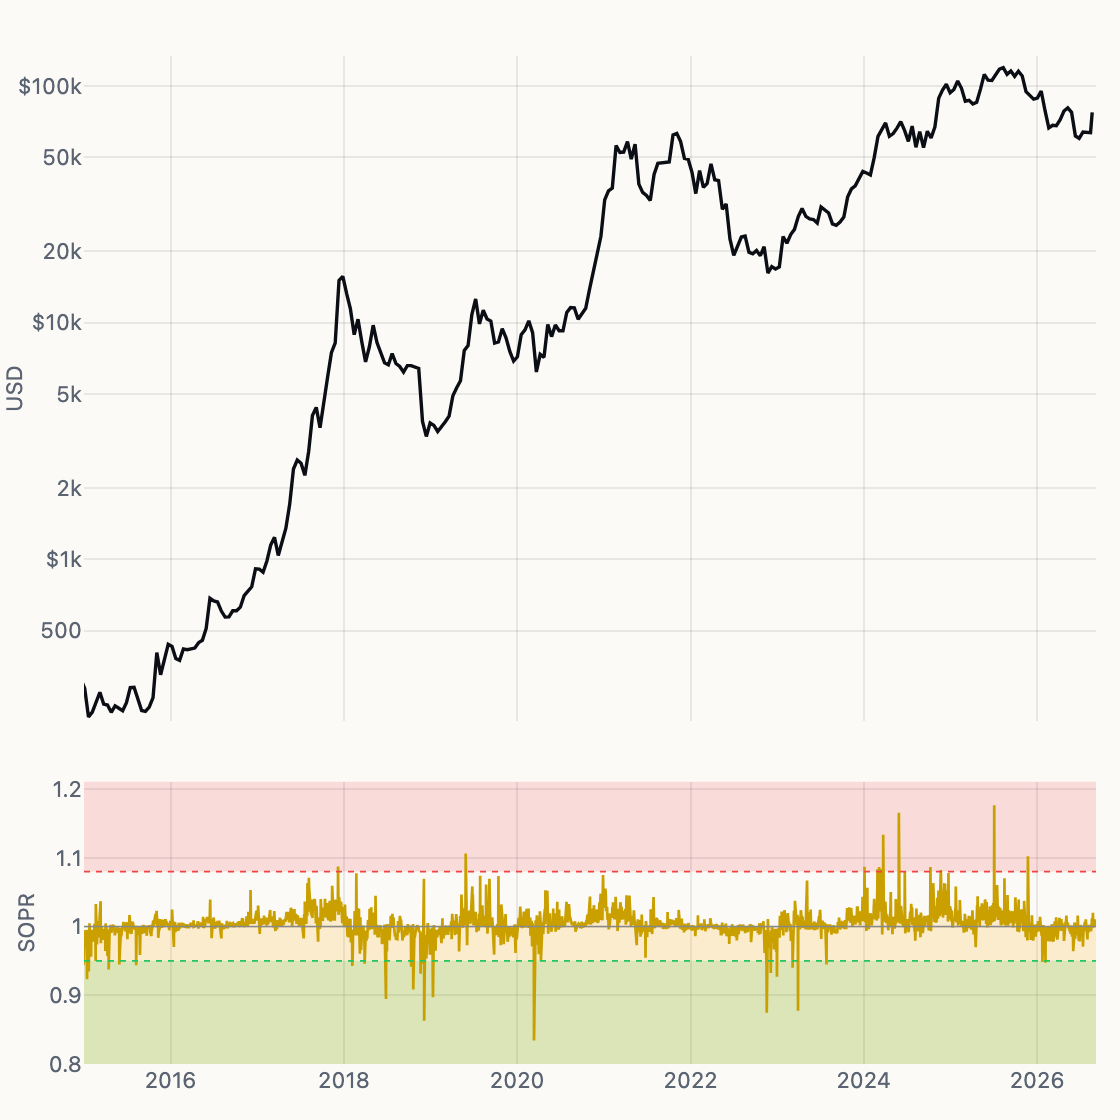
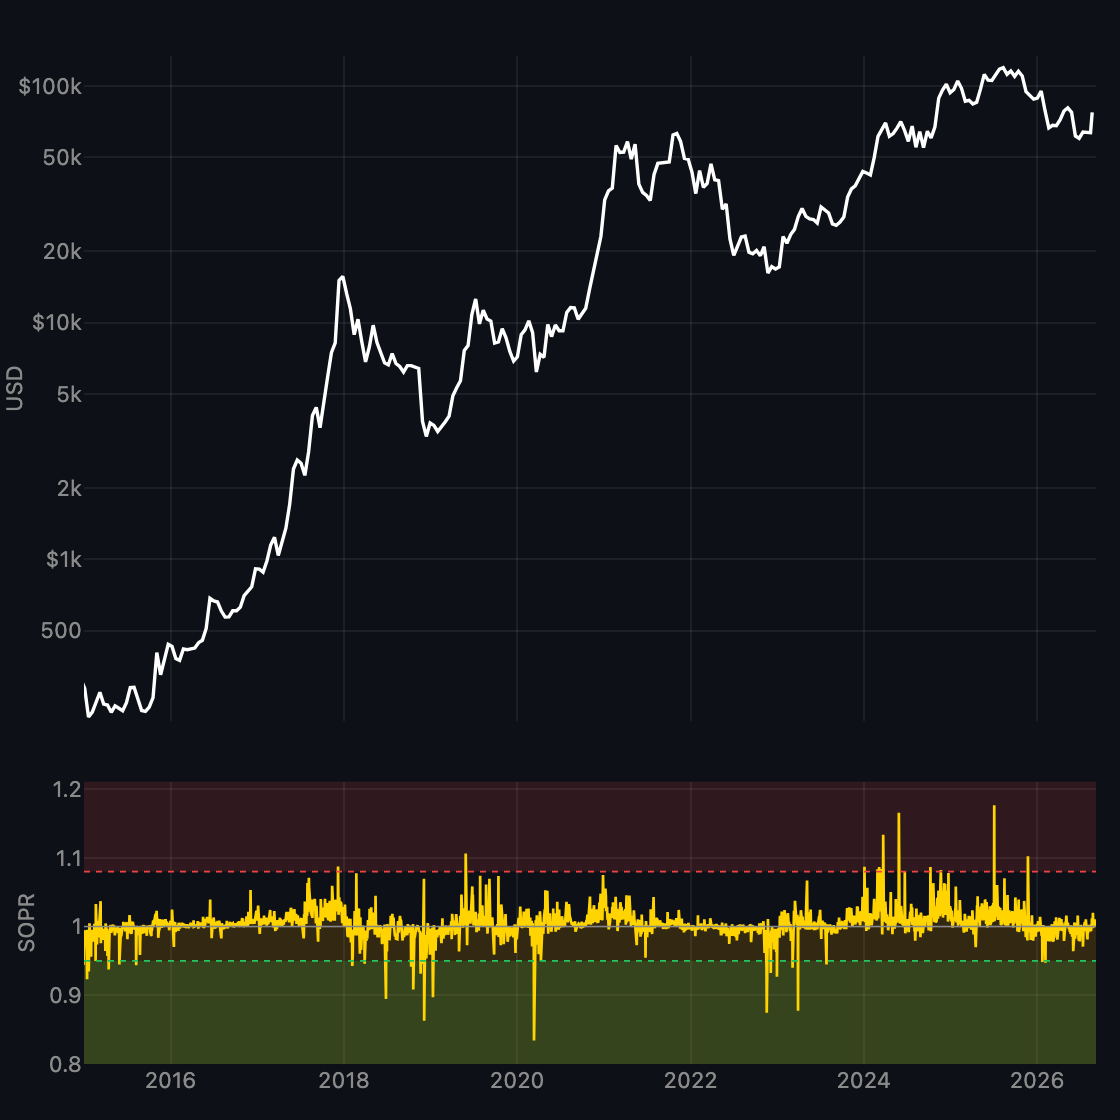
SOPR
Spent-output profit ratio — coins sold above or below cost.
-
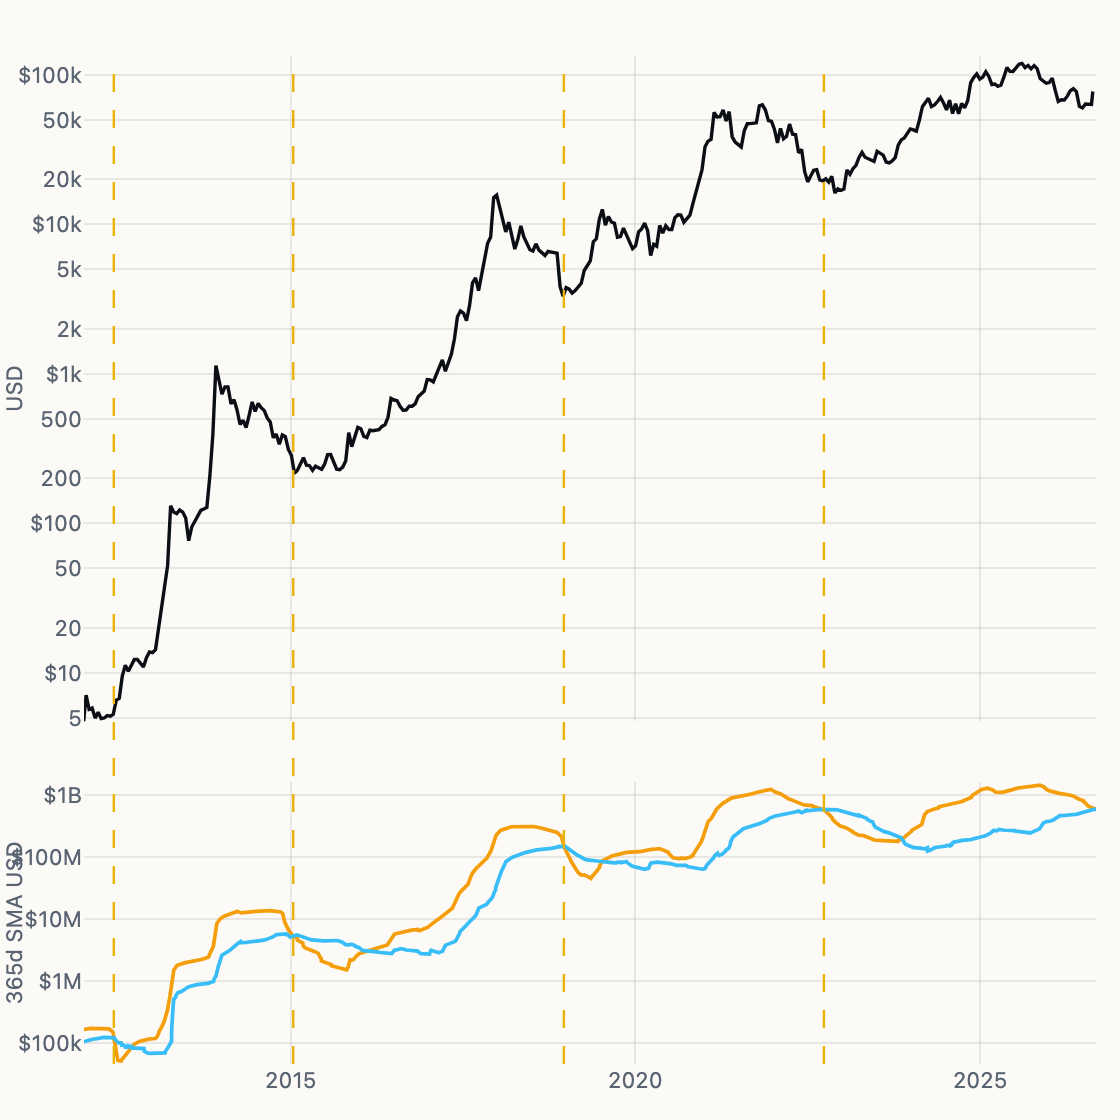
Realized Profit vs Loss
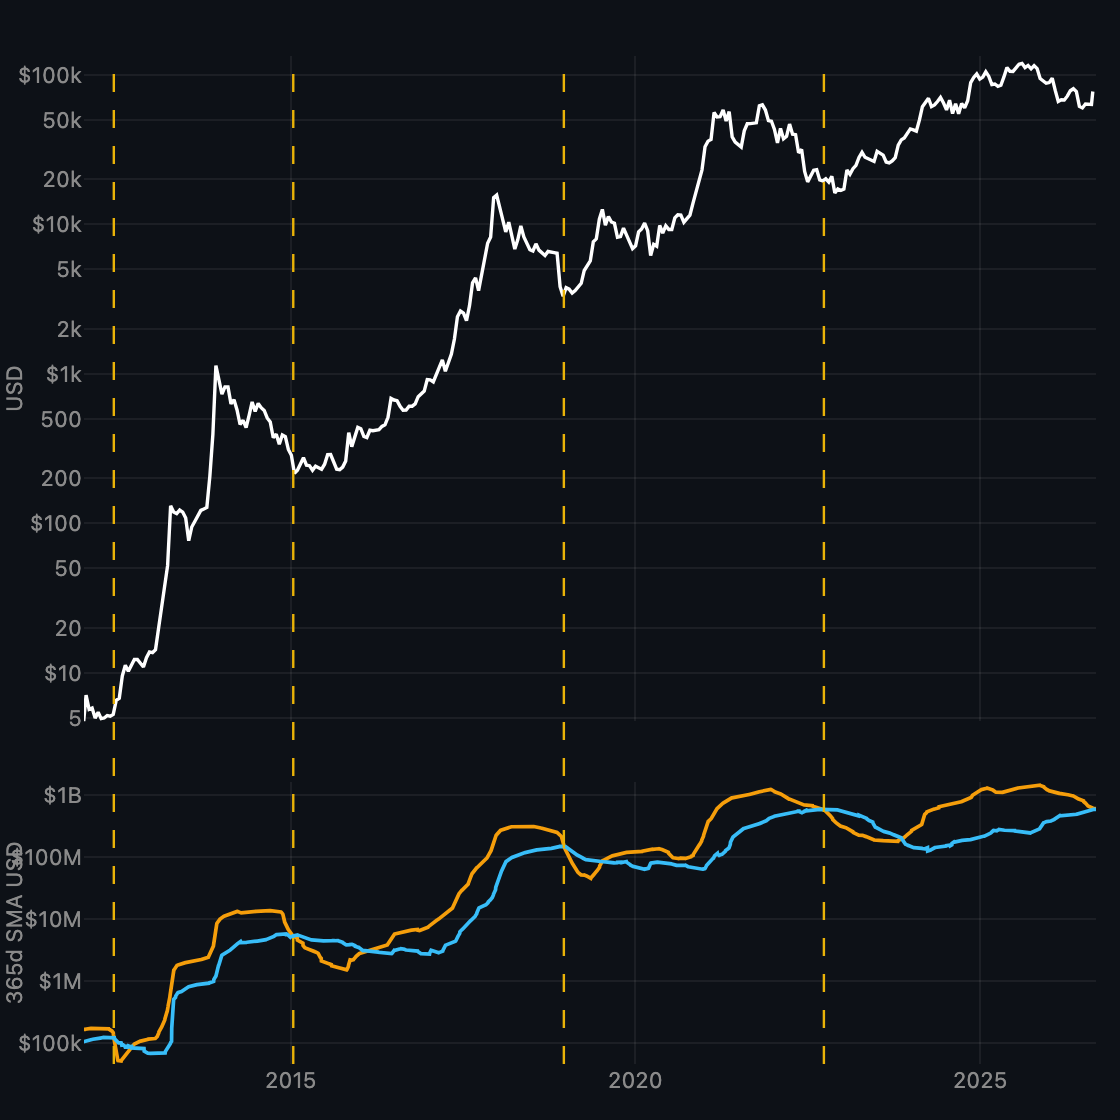
Log price on top. Below: 365-day SMAs of realized profit (orange) and realized loss (blue). A dead cross — profit SMA dropping through loss SMA — has marked every cycle bottom since 2012.
-
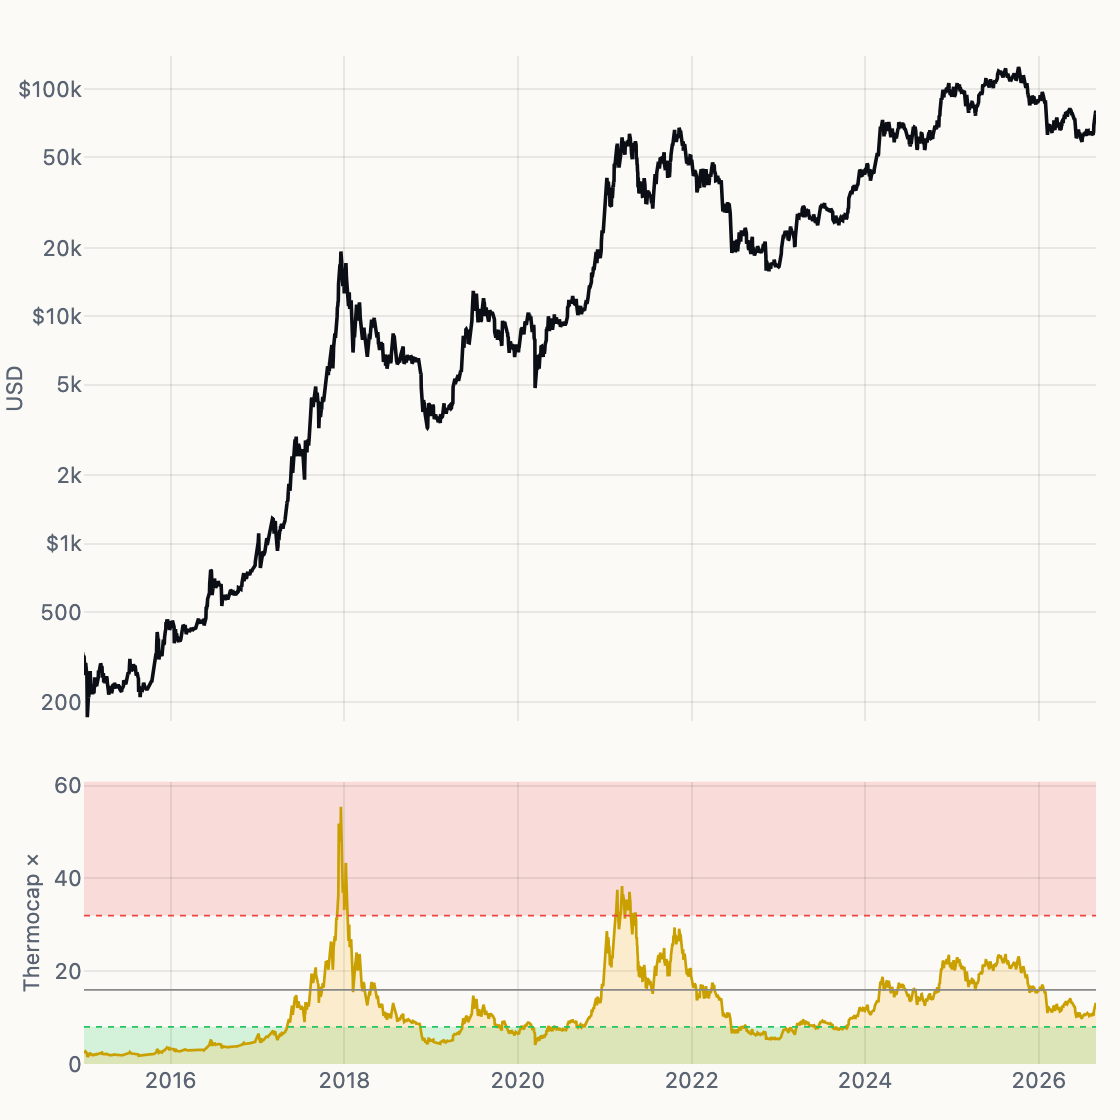
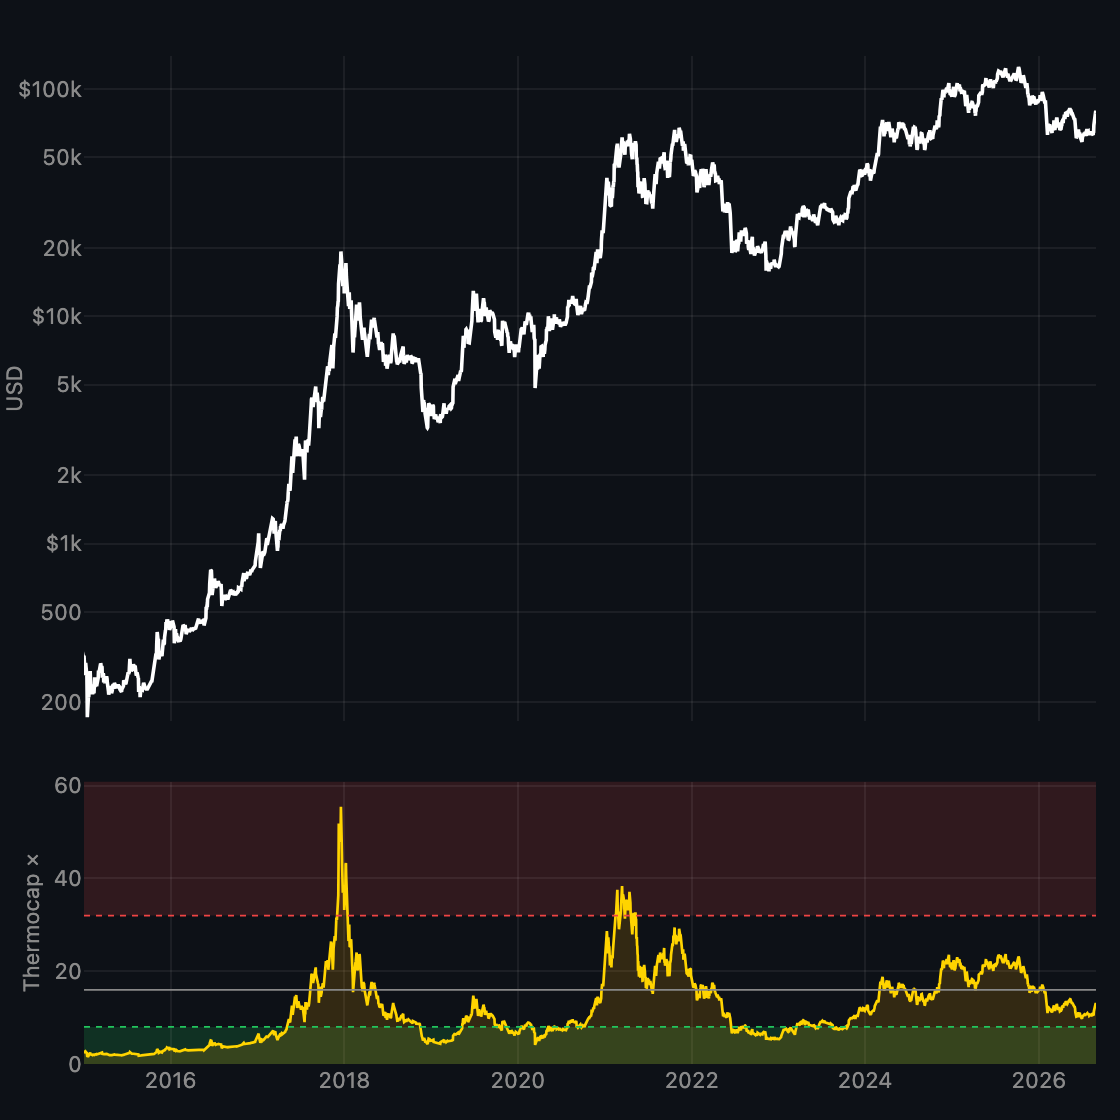
Thermocap Multiple
Spot divided by cumulative miner revenue (thermocap price).
-
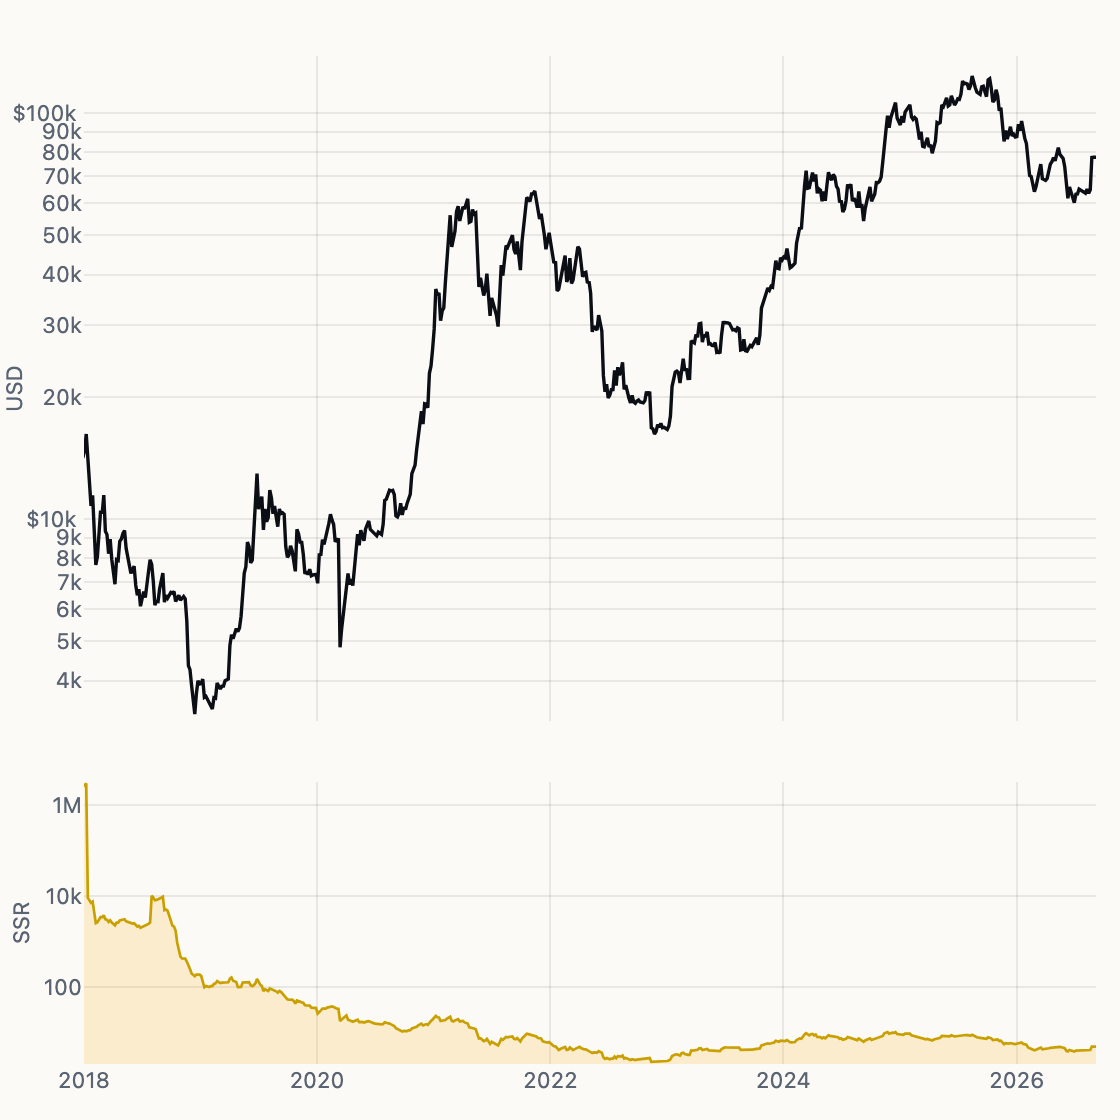
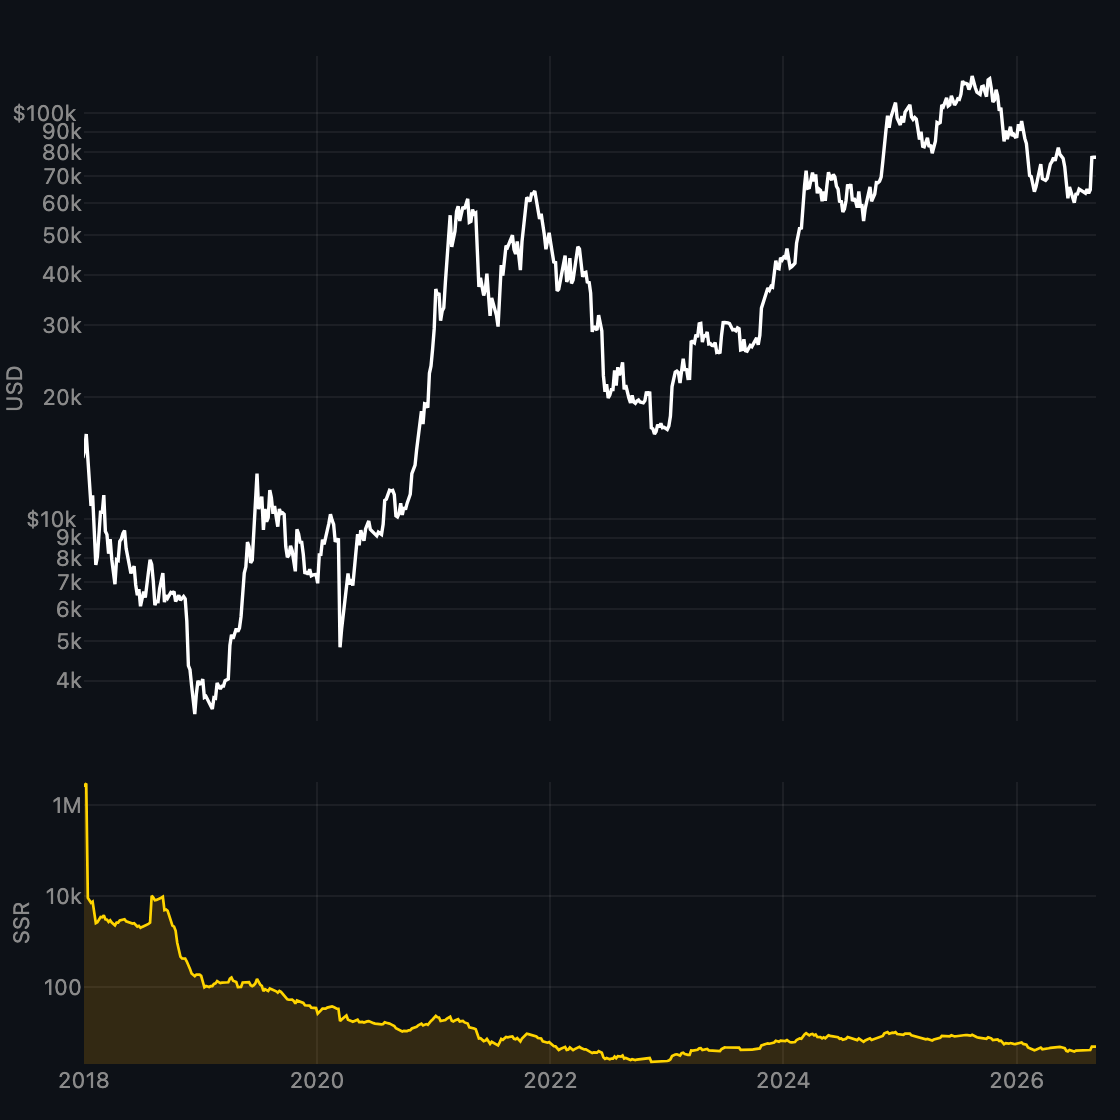
Stablecoin Supply Ratio
Bitcoin market cap divided by major-stablecoin supply.
-
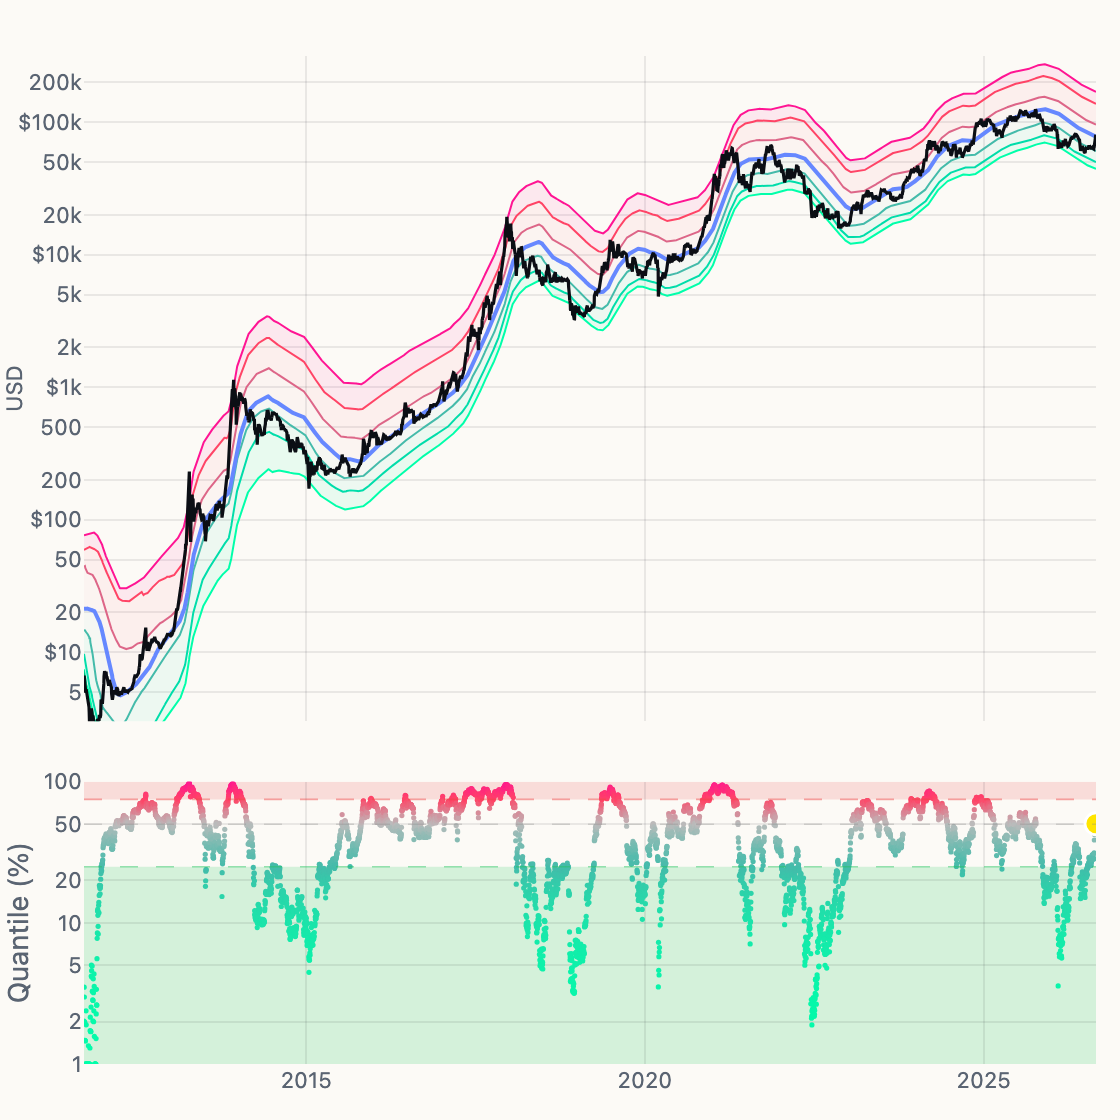
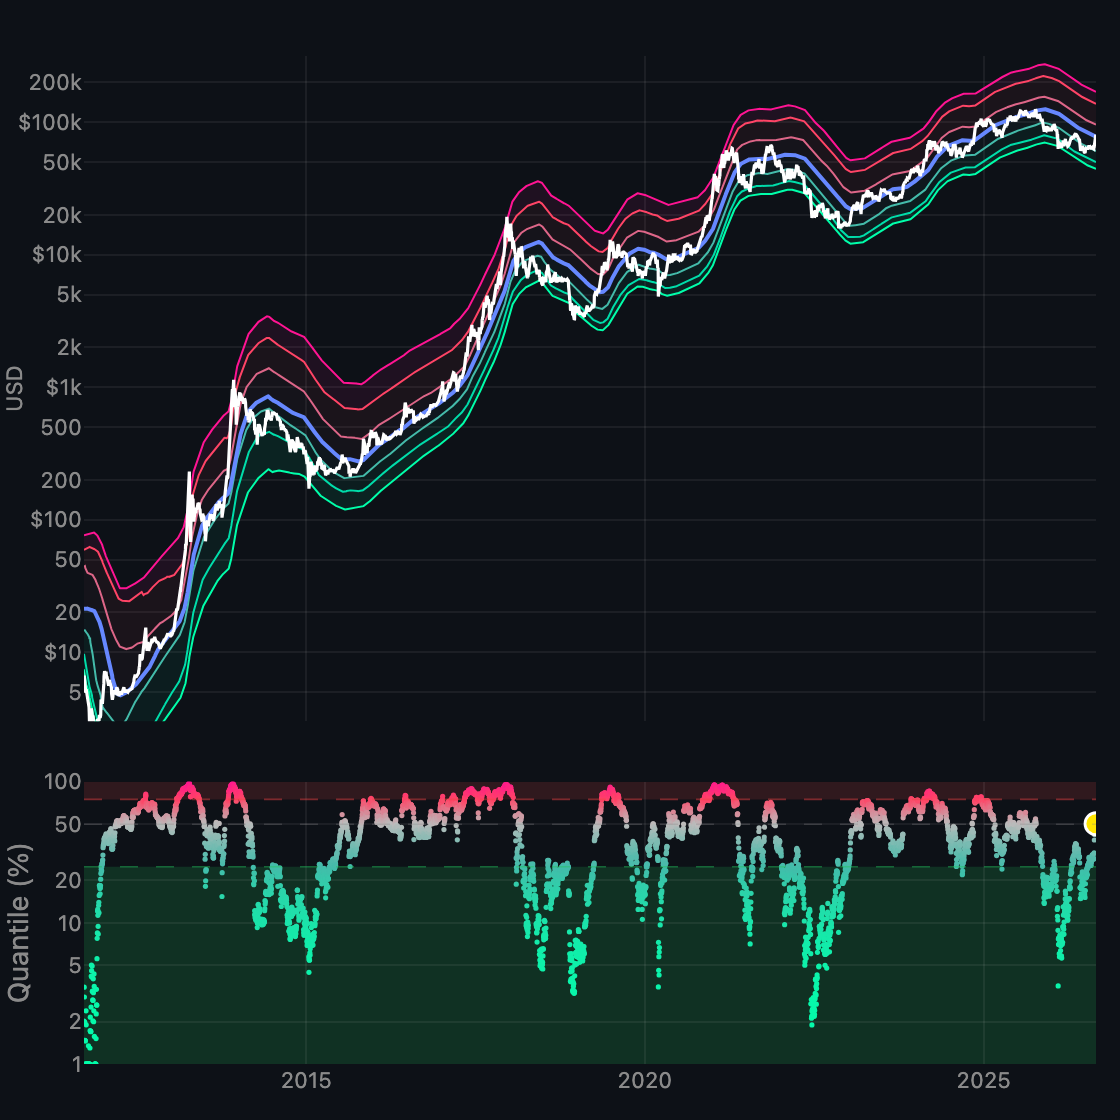
200DMA Quantile Regression
Log price with expanding-window 200DMA quantile bands (Q5–Q95) and a 0–100 oscillator.
-
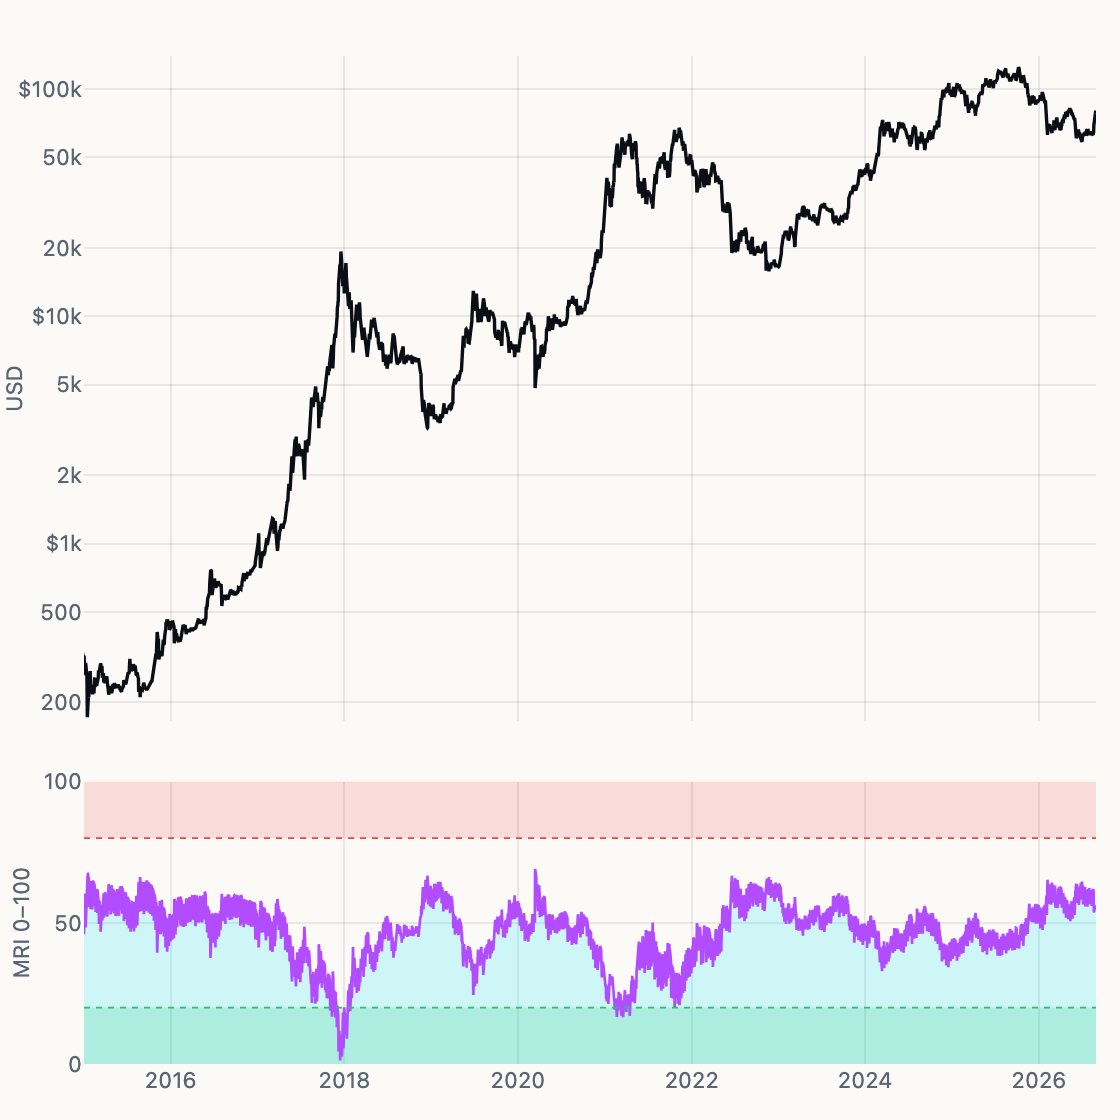
Mean Reversion Index
Equal-weight blend of six cost-basis models.
-
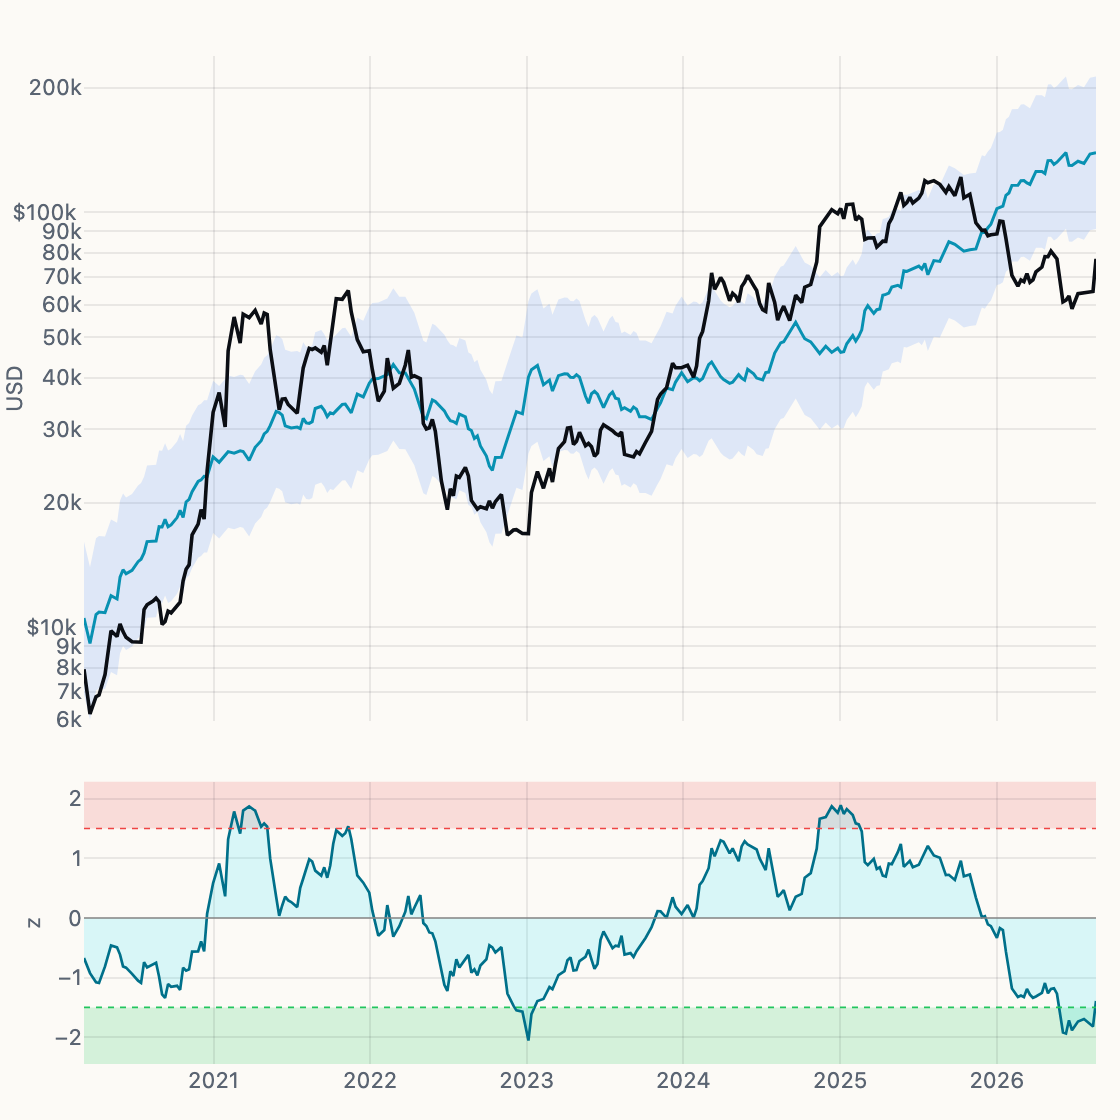
Global Liquidity Fair Value
BTC regressed on global M2 with σ bands.
-
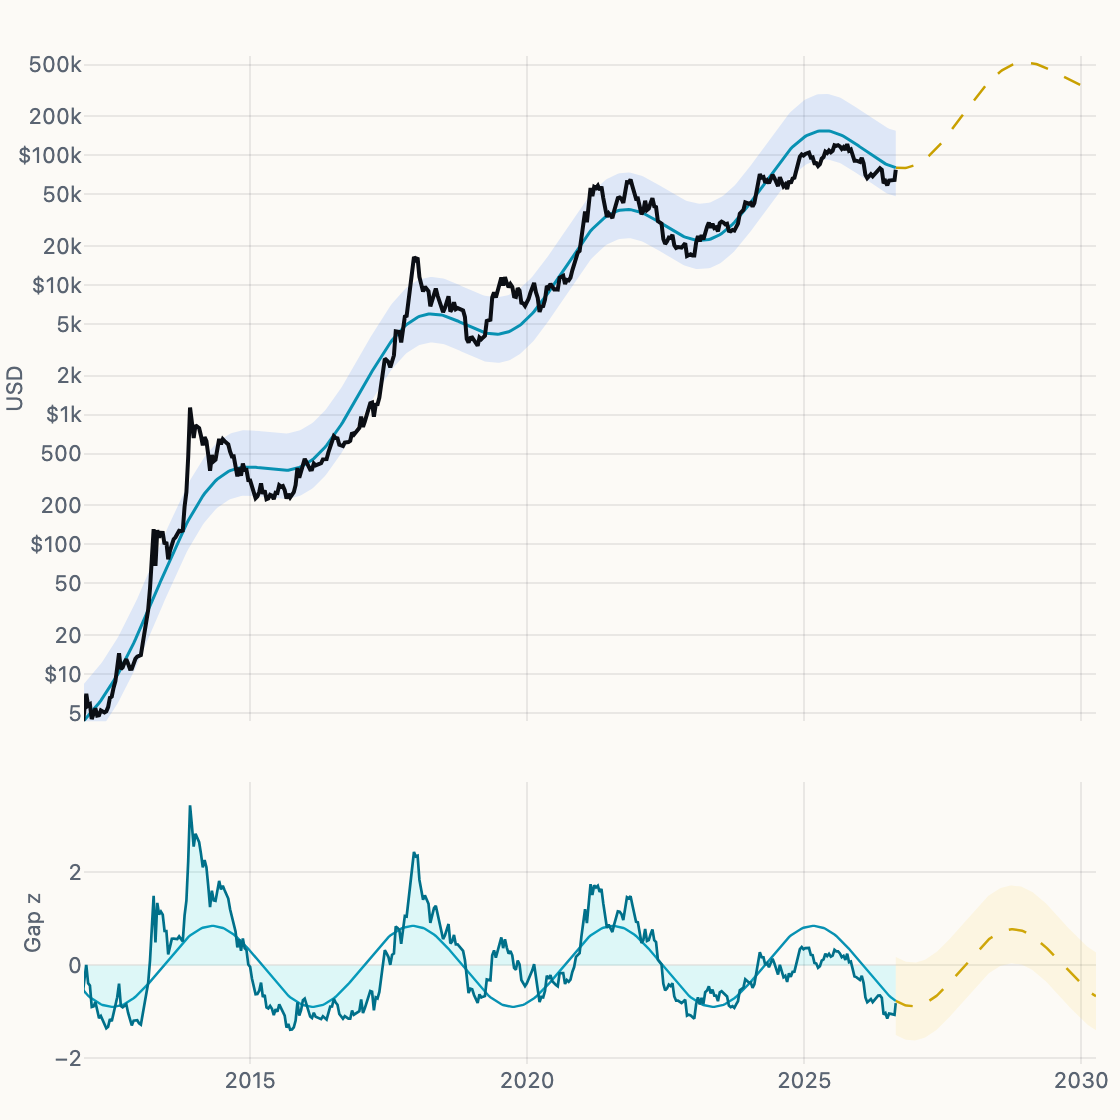
Damped Harmonic Oscillator
Damped cycle bands around the power law.
-
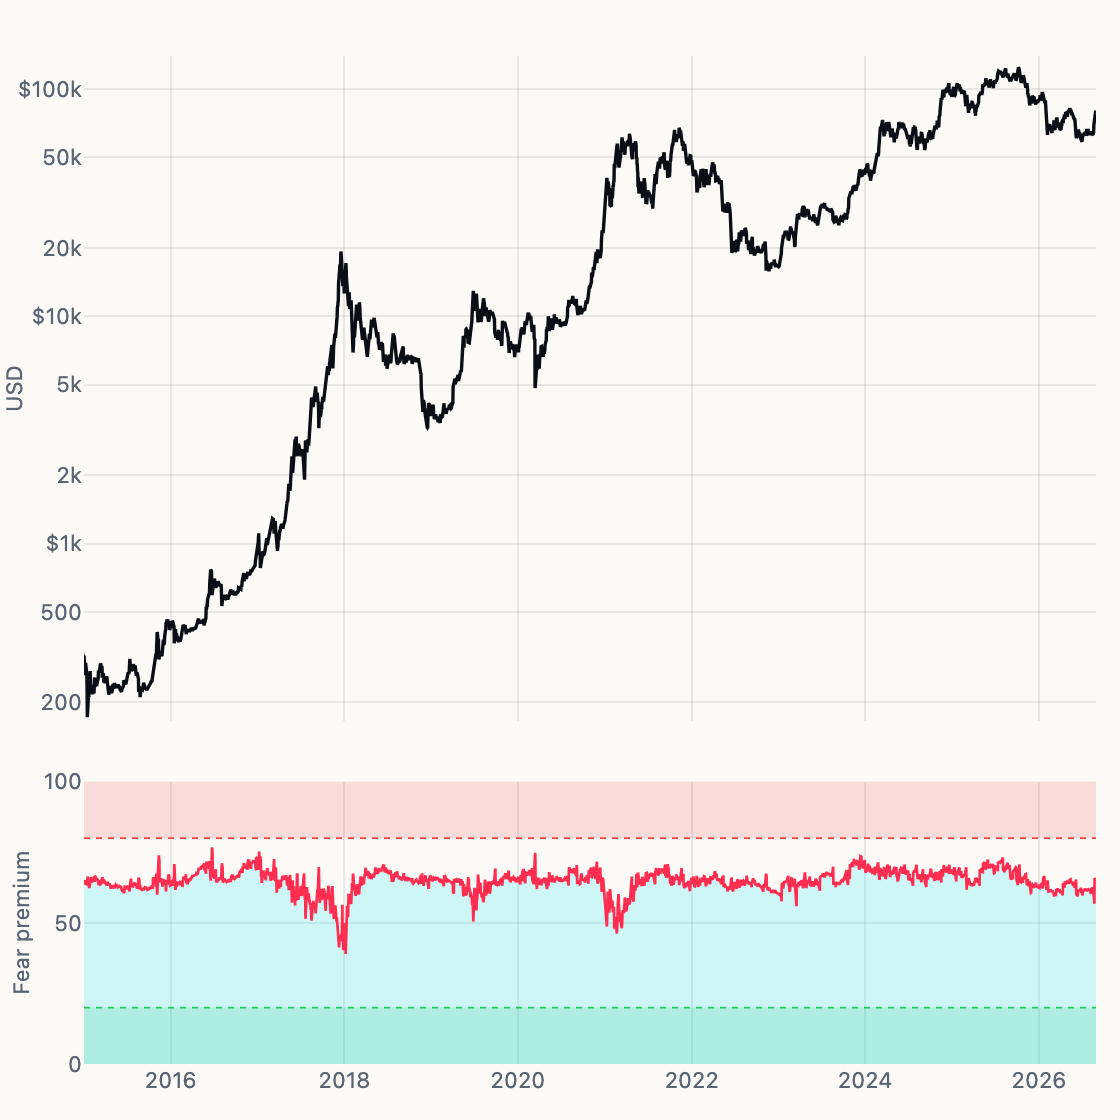
Fear Premium
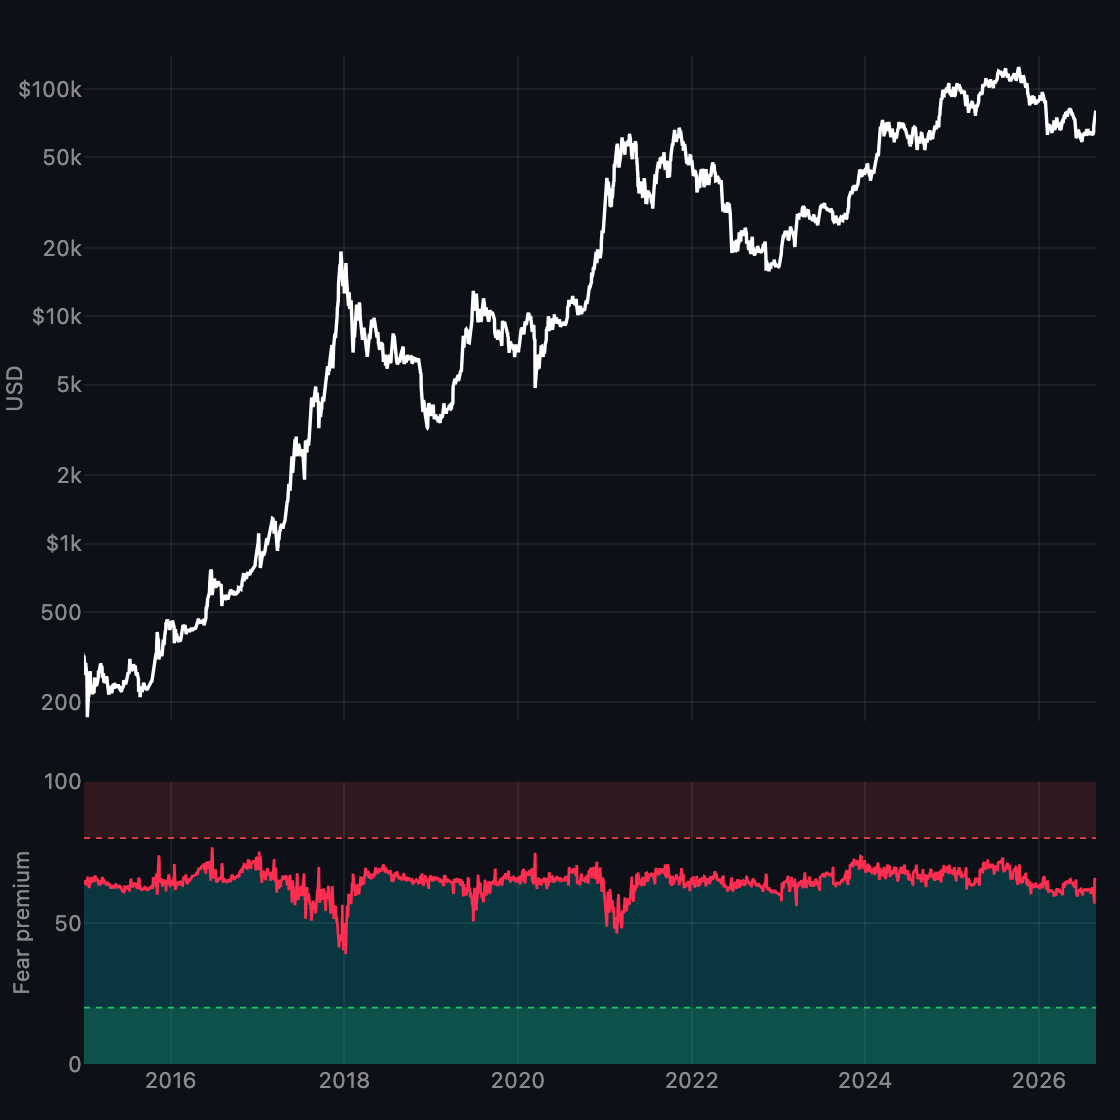
Composite fair-value fear/greed gauge 0–100.
-
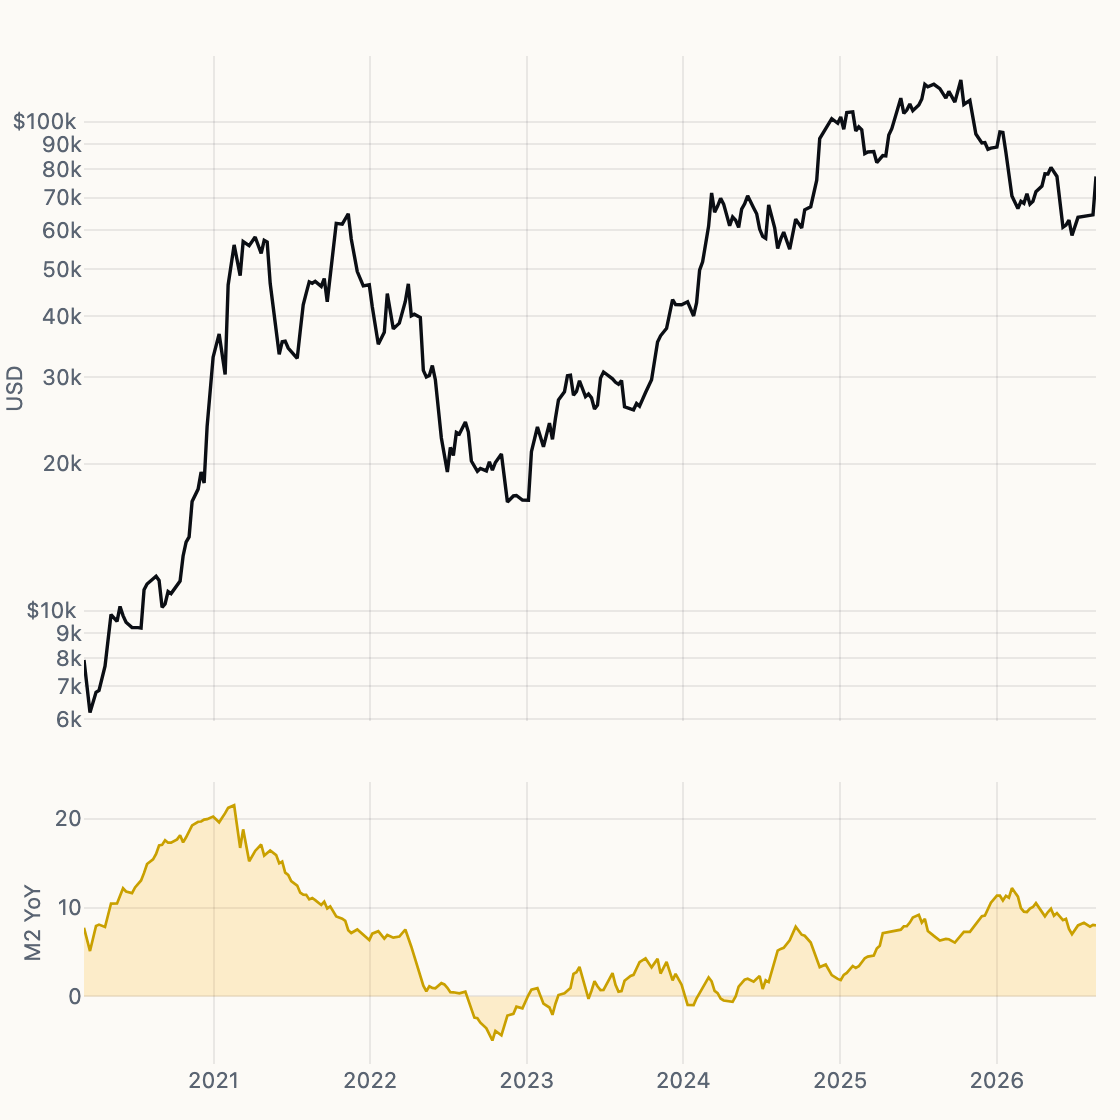
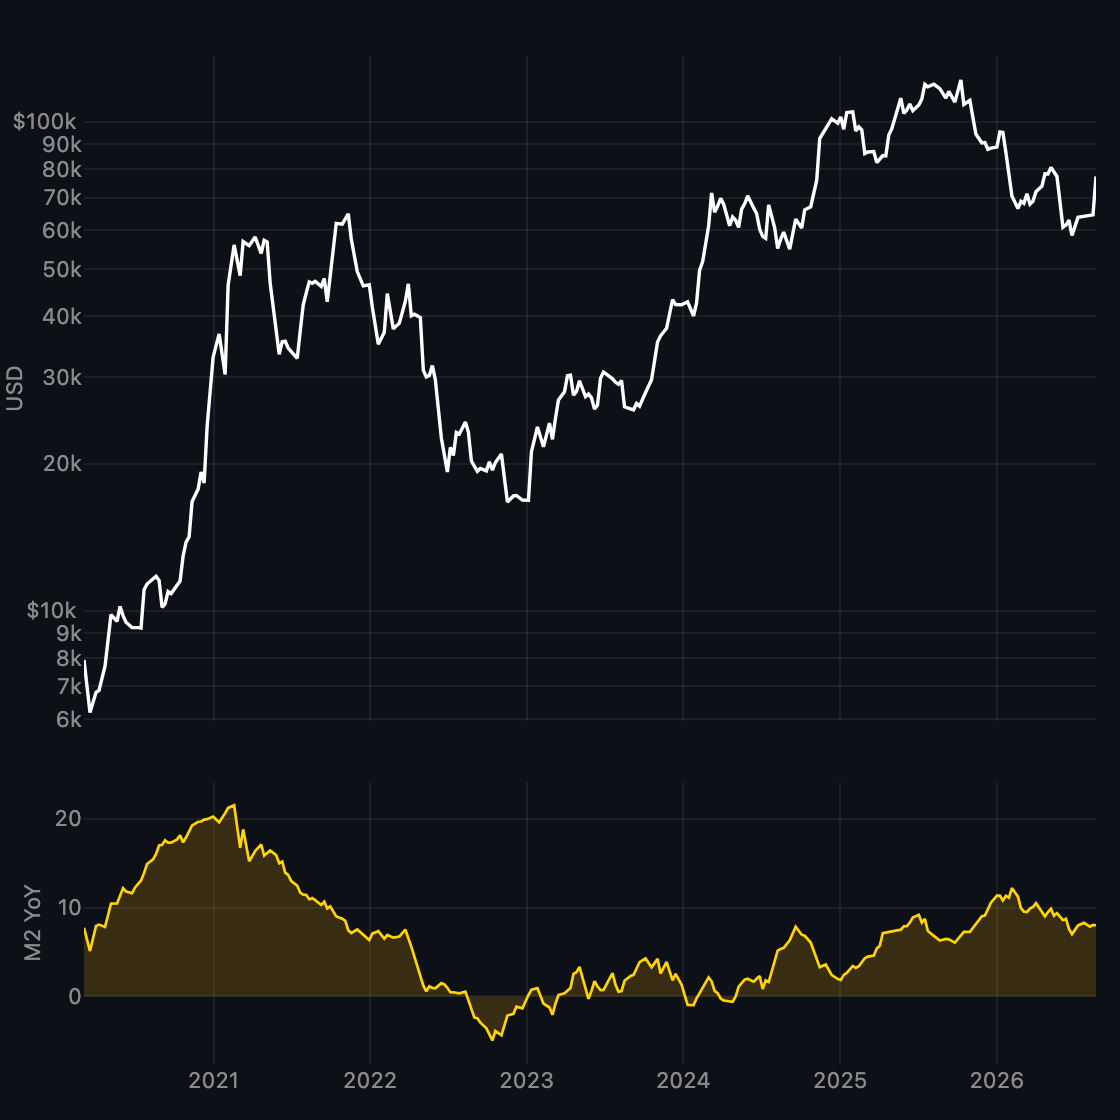
M2 YoY Overlay
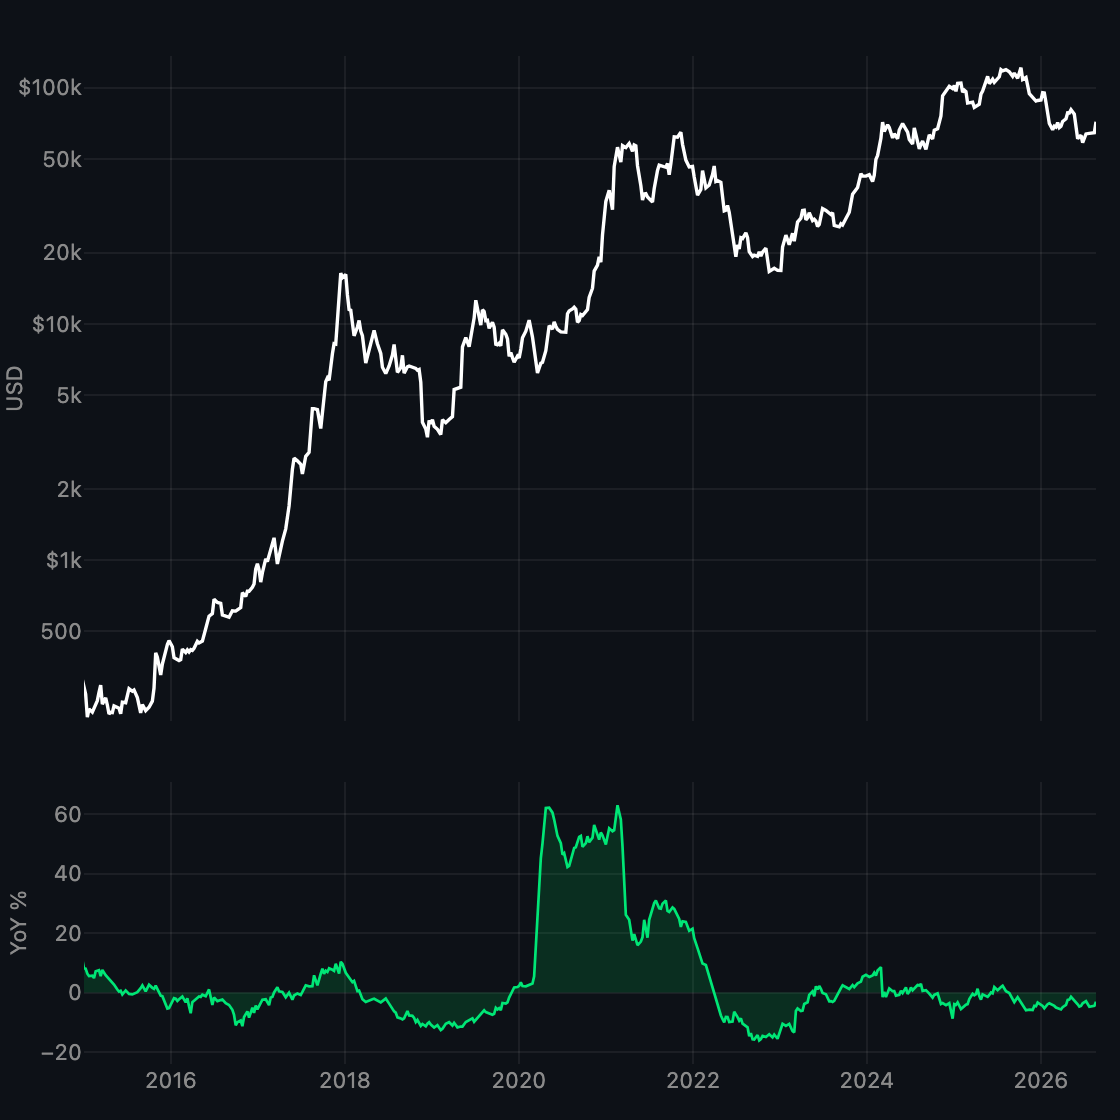
Global M2 year-over-year vs BTC price.
-
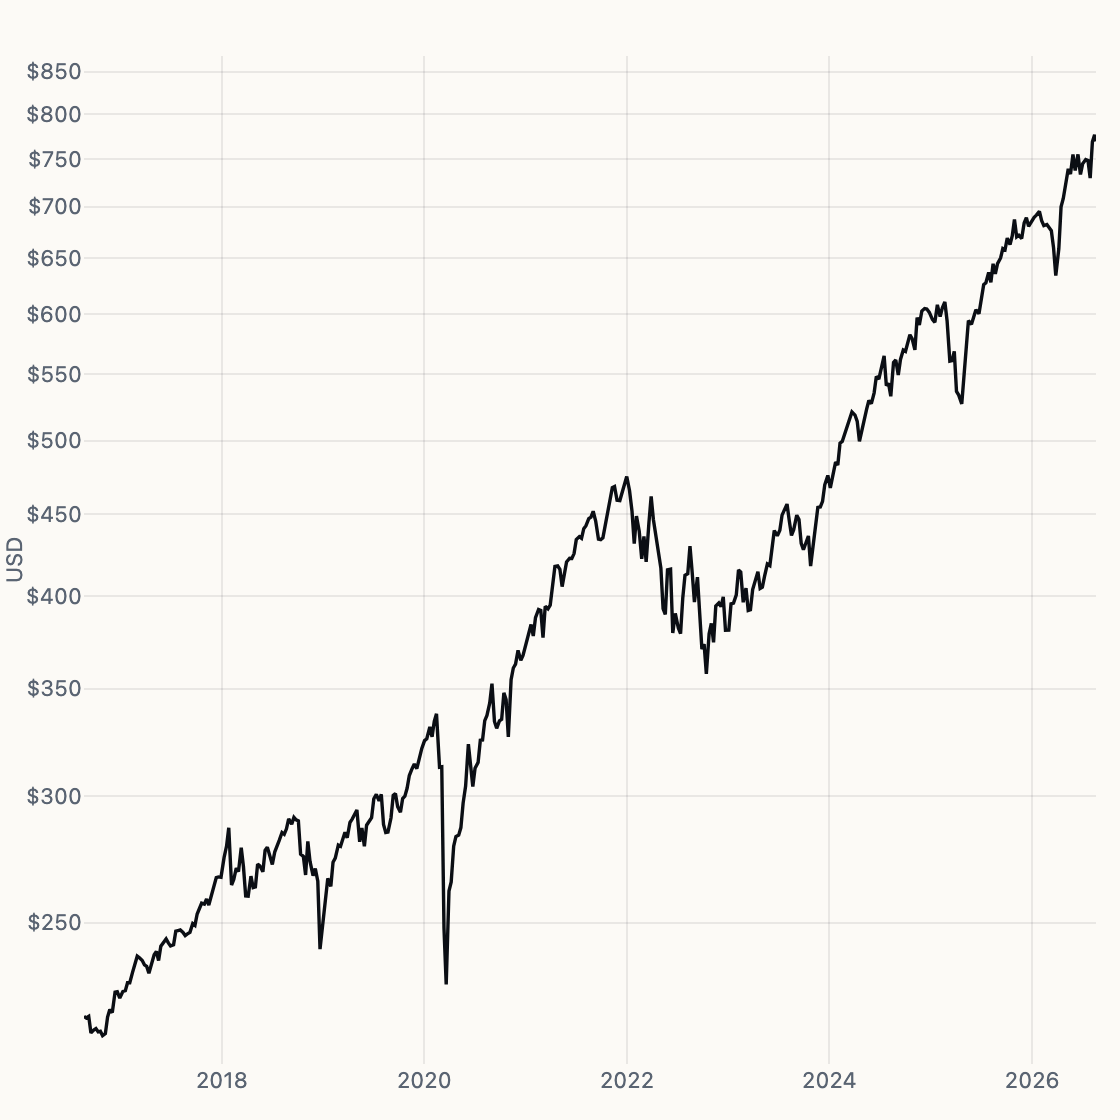
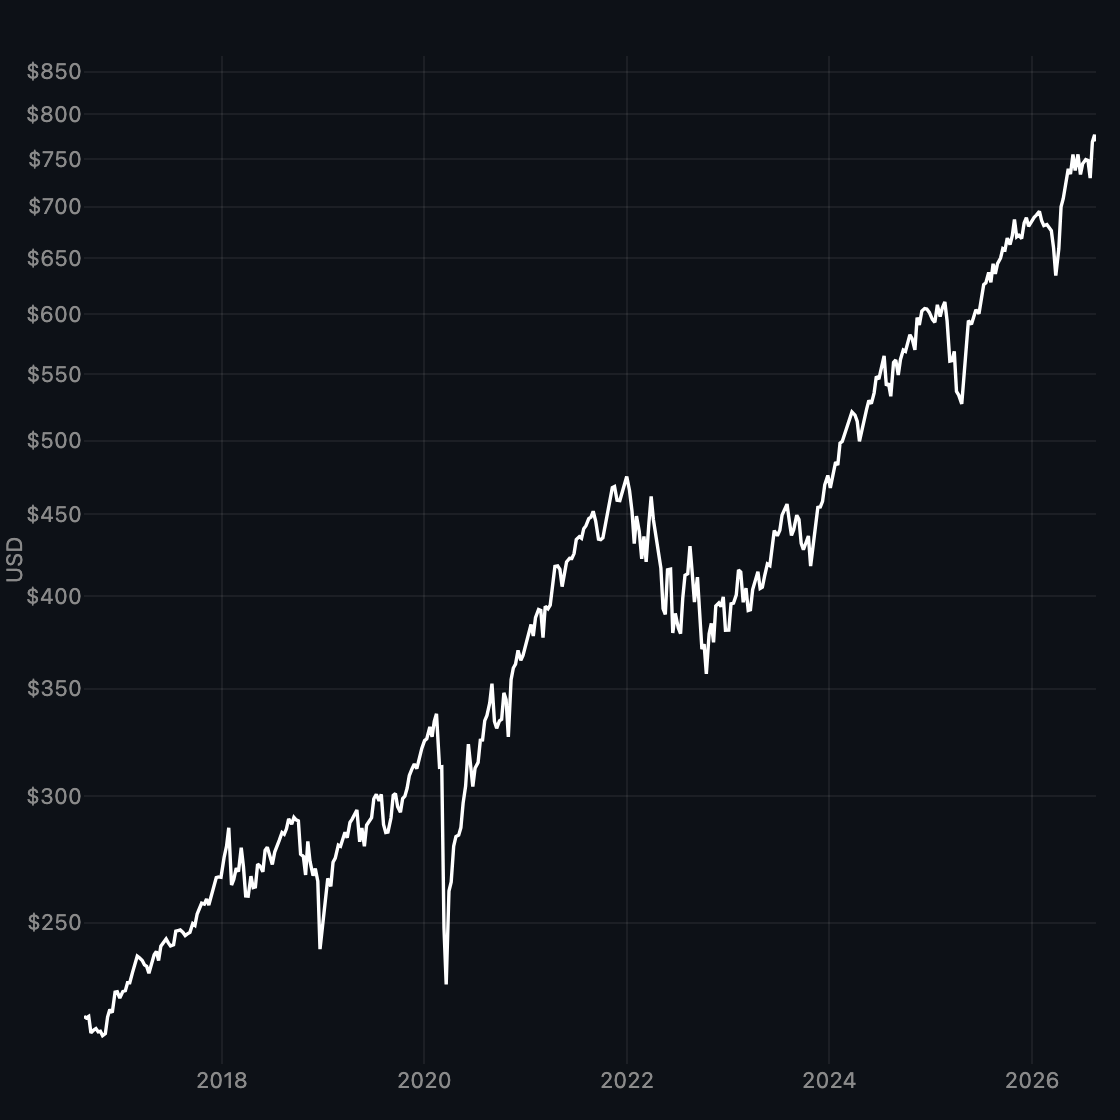
SPY
S&P 500 ETF daily close — the equity risk baseline.
-
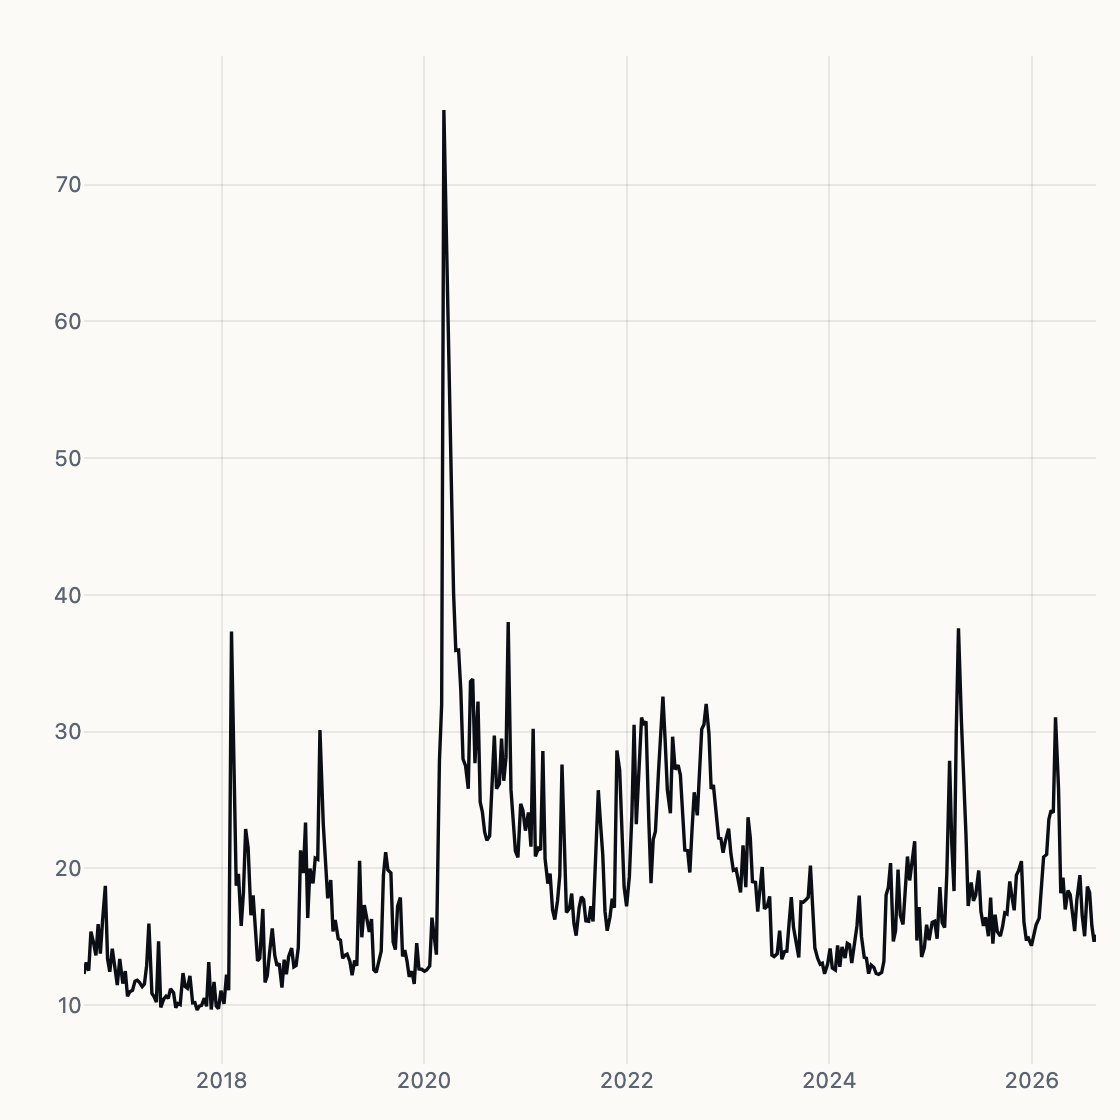
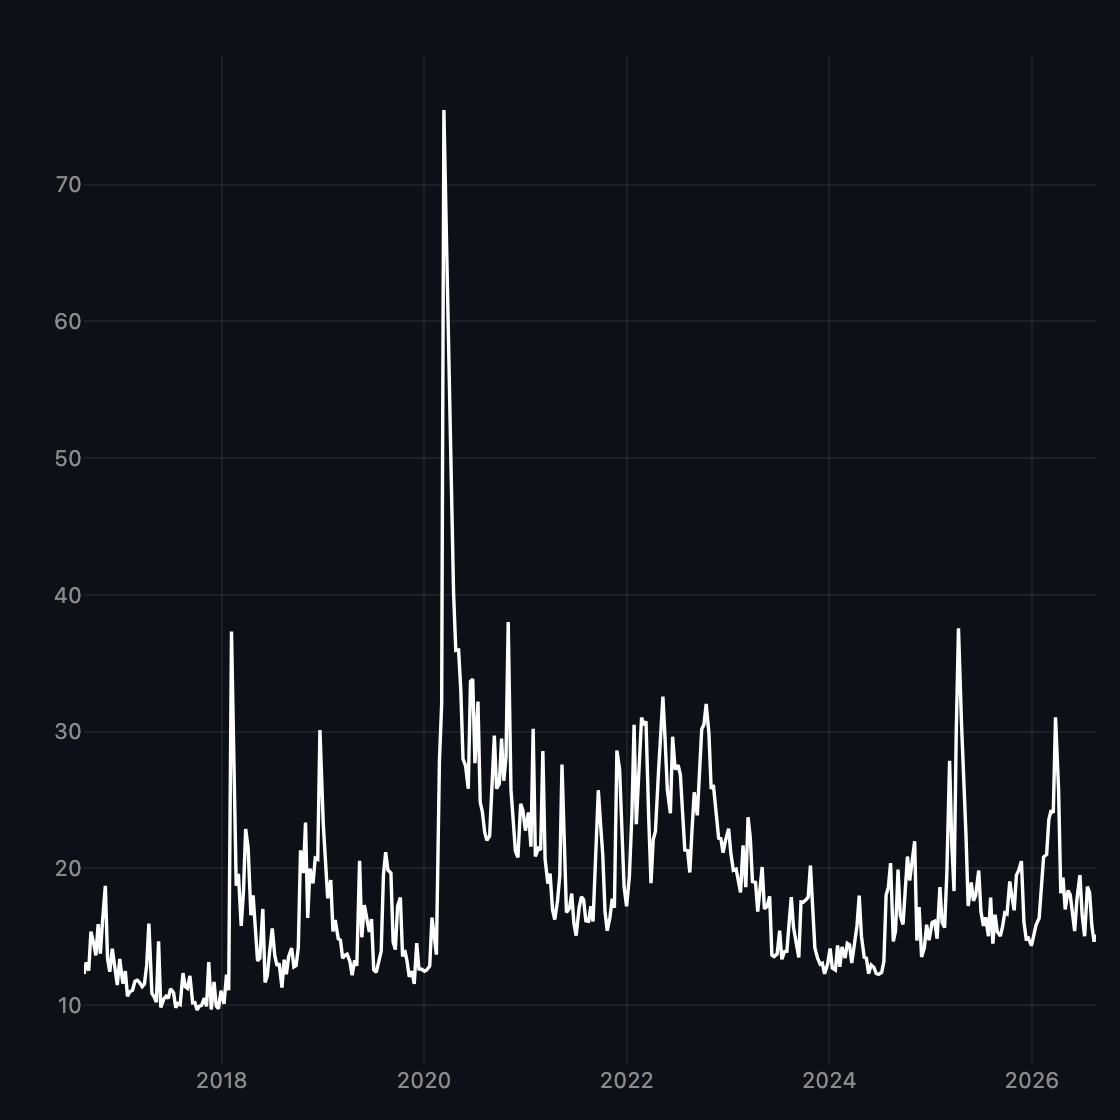
VIX
CBOE implied vol — the risk bid on US equities.
-
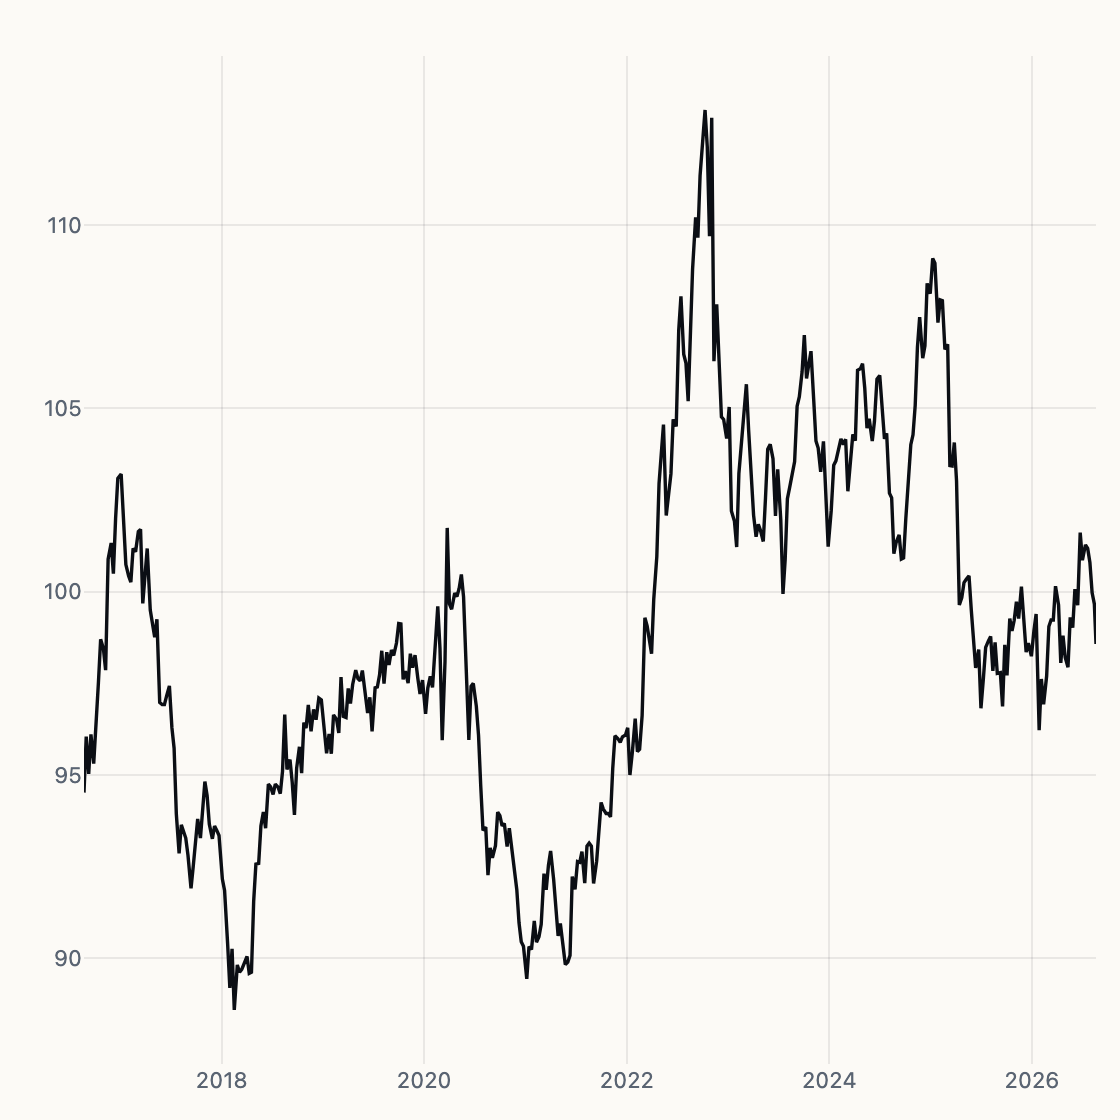
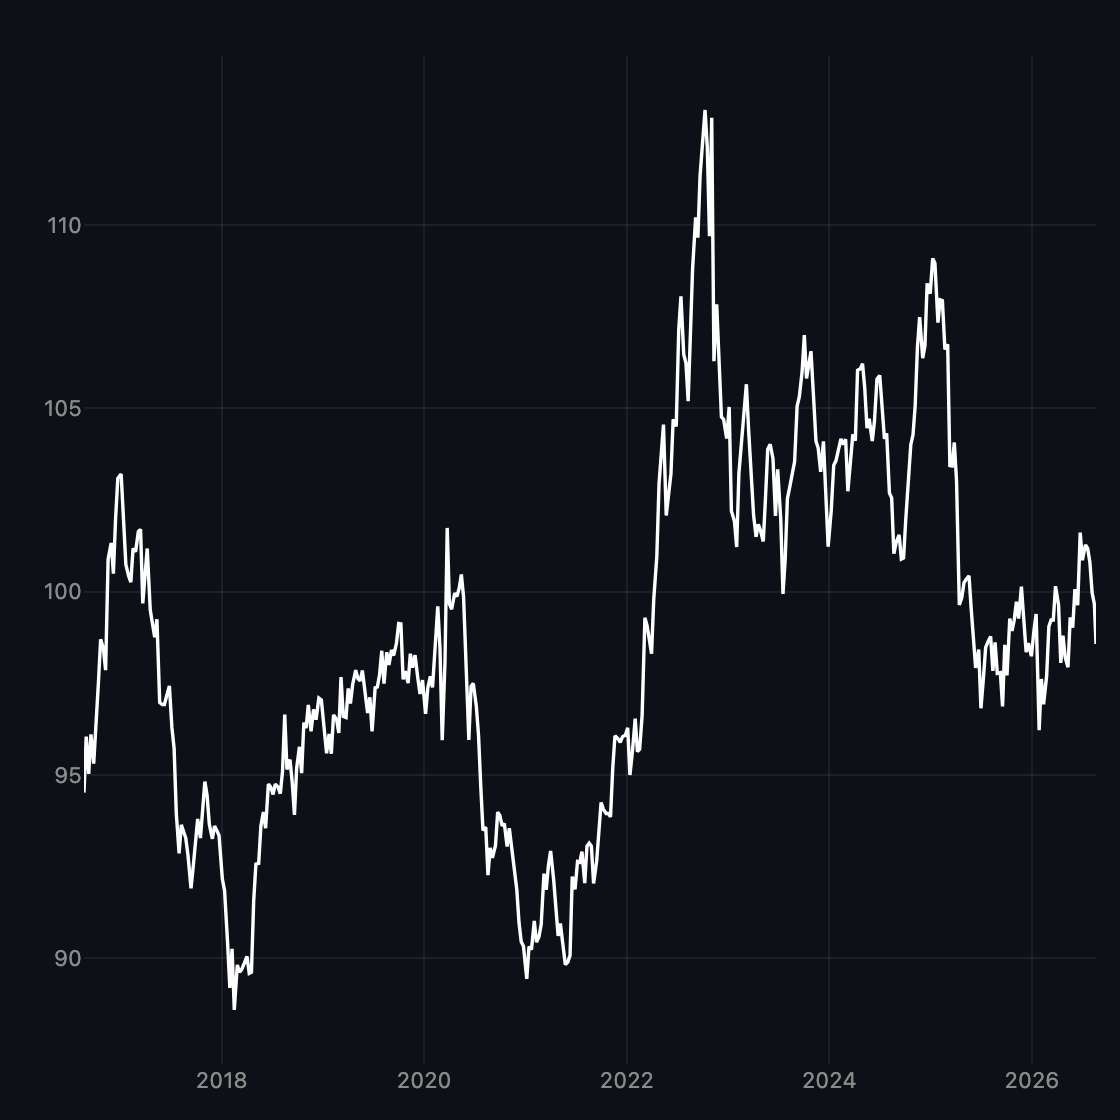
DXY
ICE US dollar index (broad USD fallback: DTWEXBGS).
-
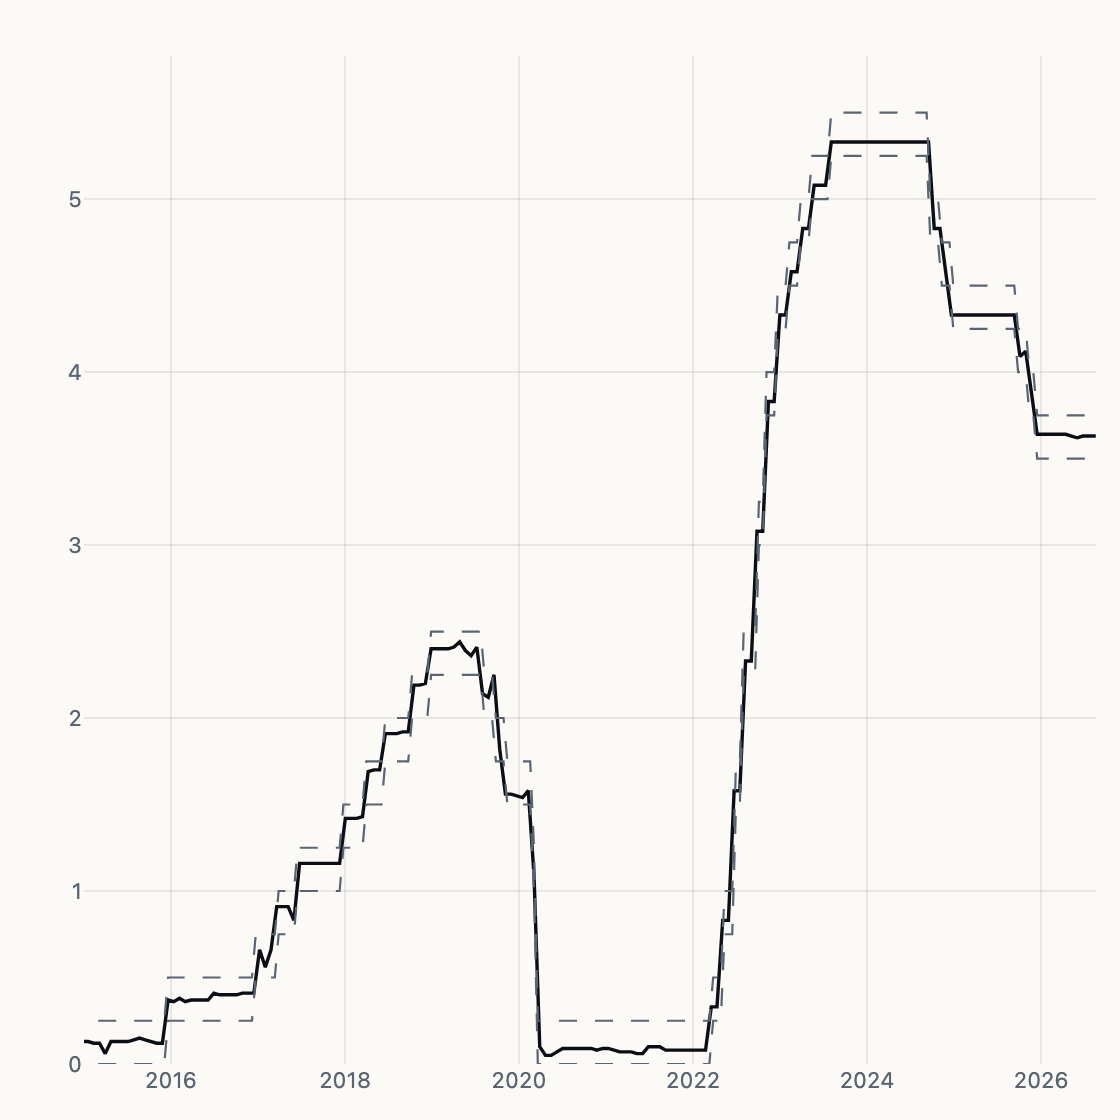
Fed Funds
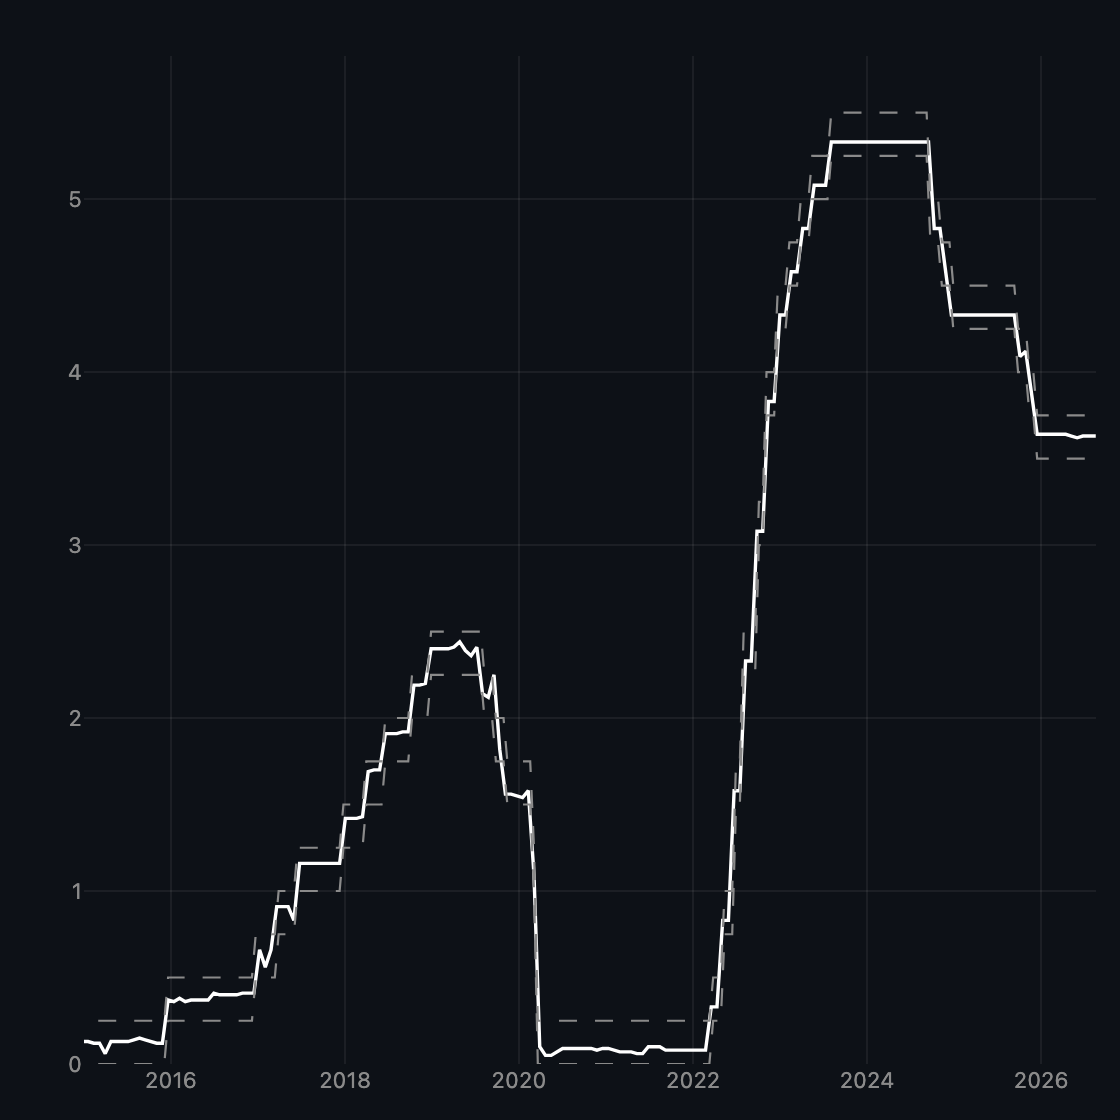
Effective federal funds rate with the target band.
-
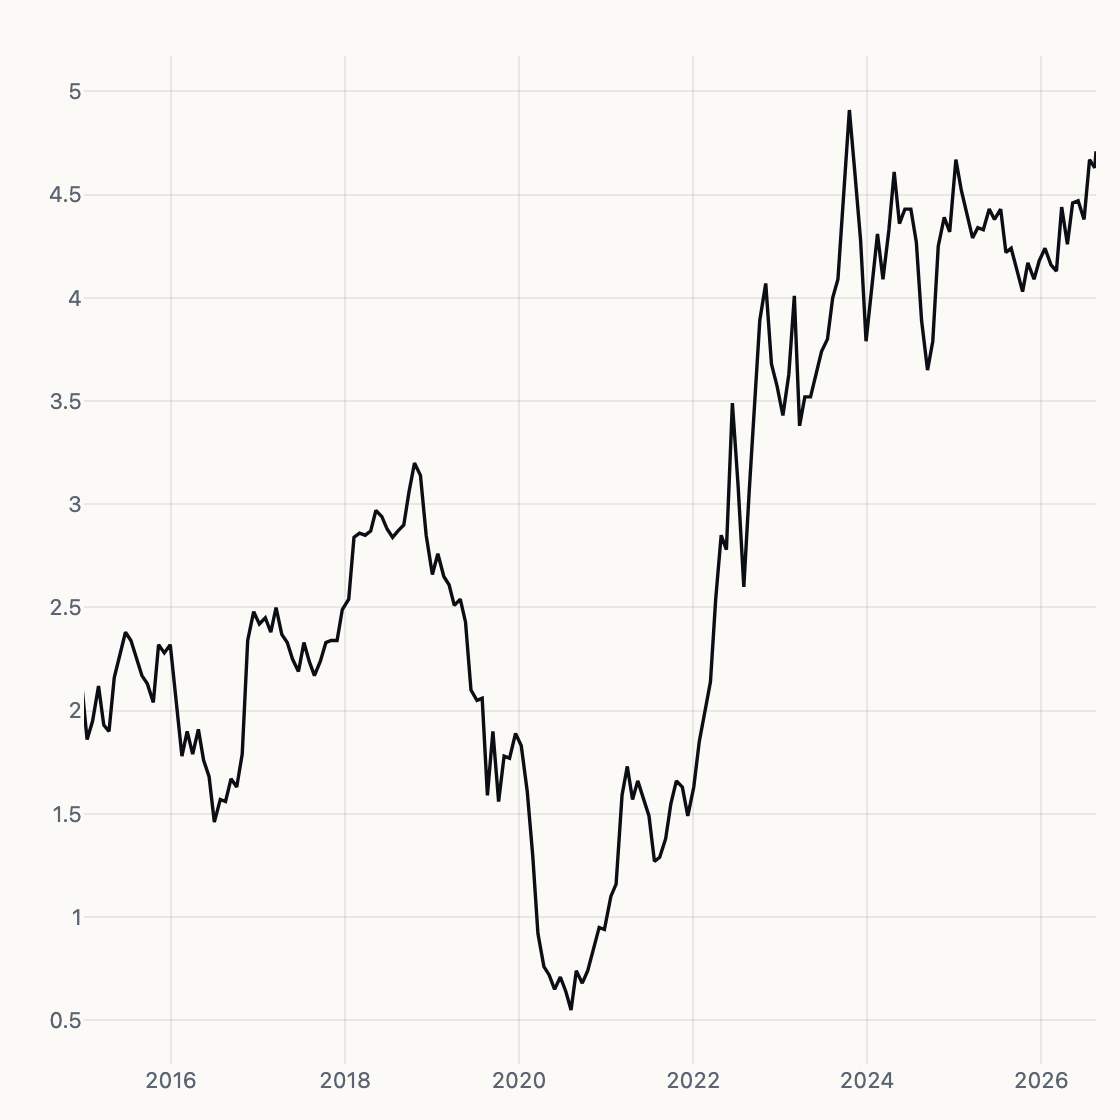
10Y Yield
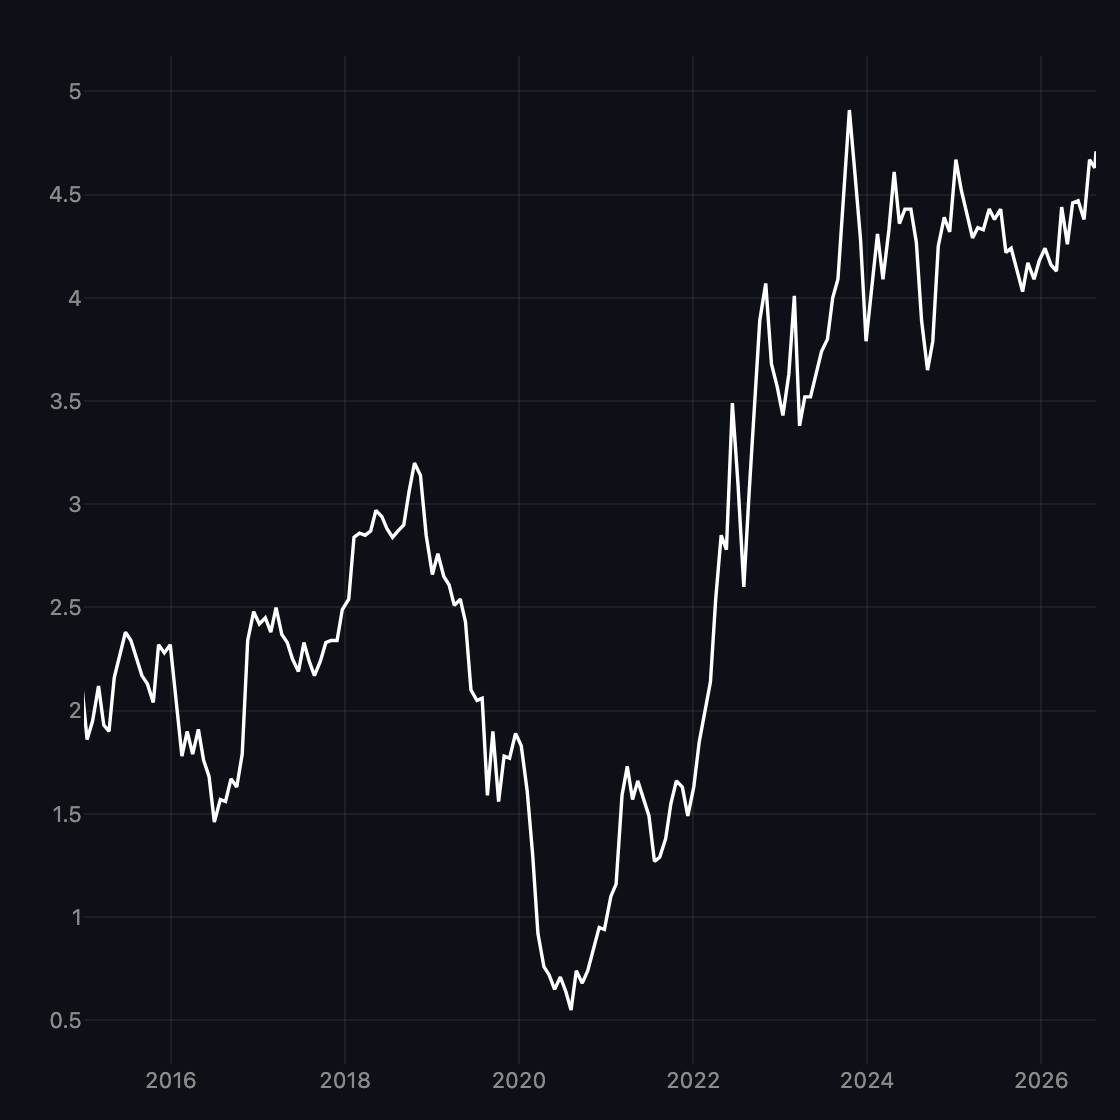
Nominal 10-year Treasury yield (DGS10).
-
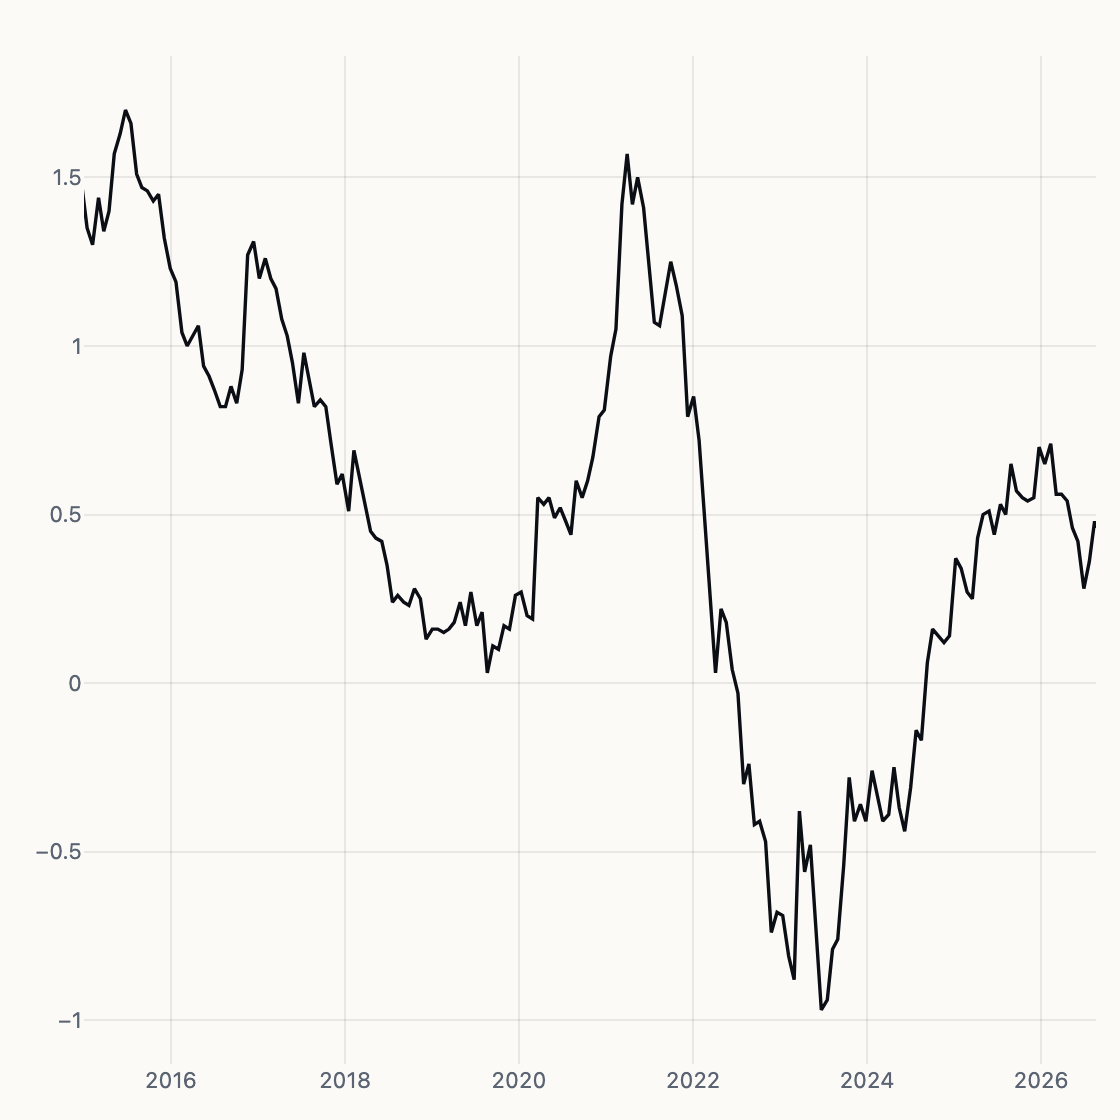
2s10s
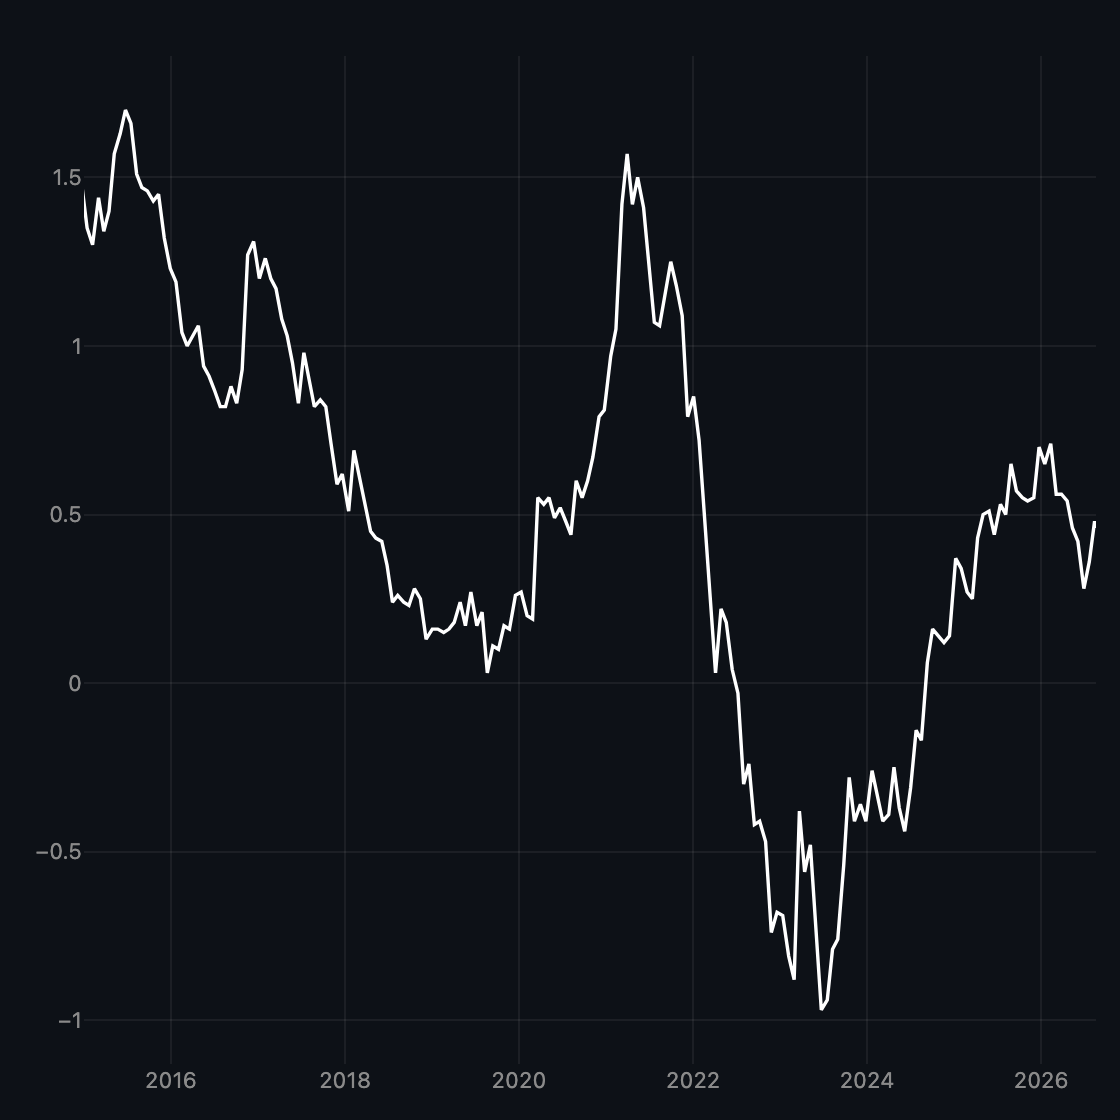
10Y − 2Y curve. Inversion is recession tape.
-
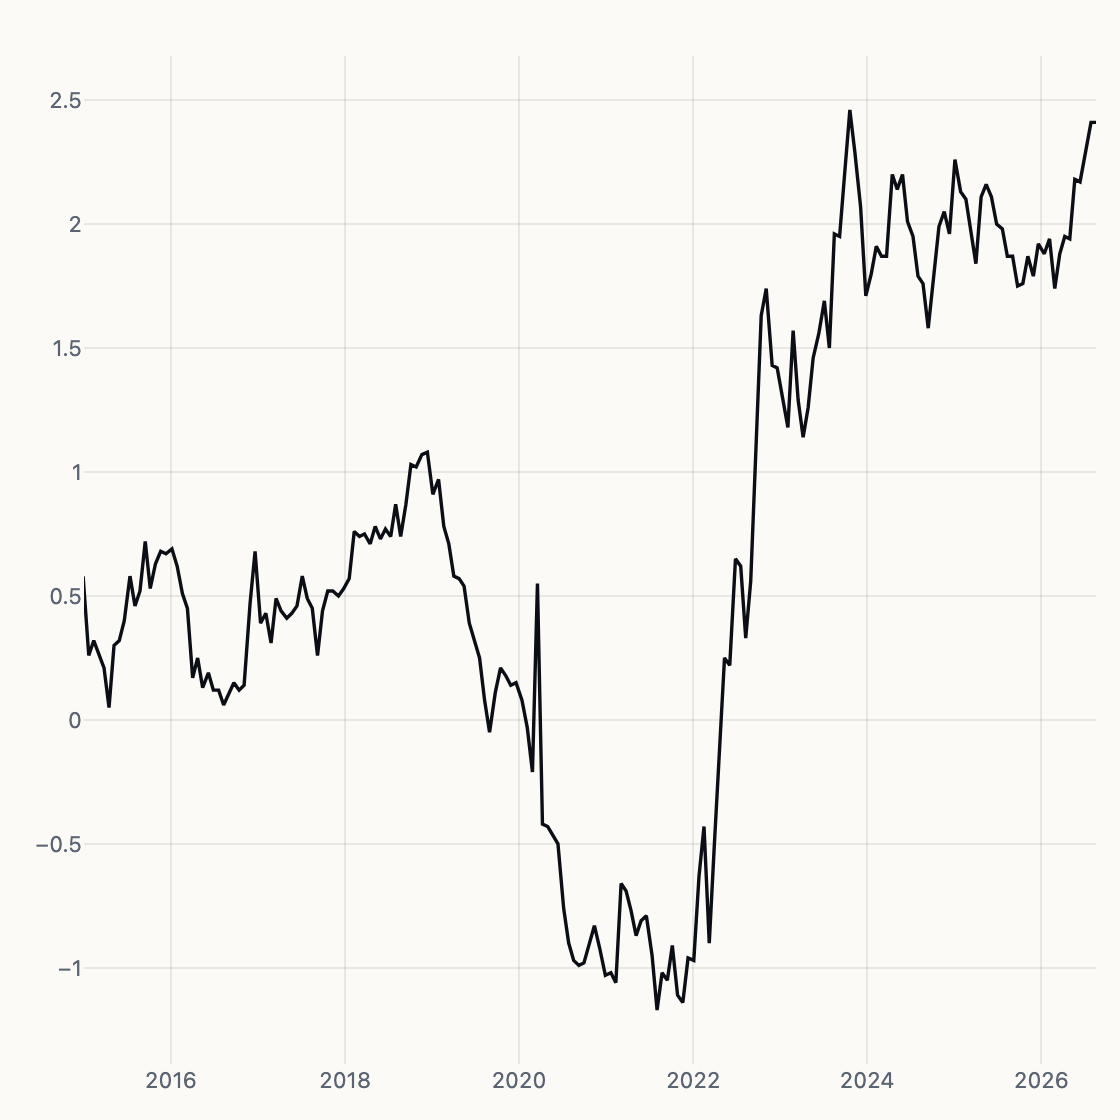
Real Yield
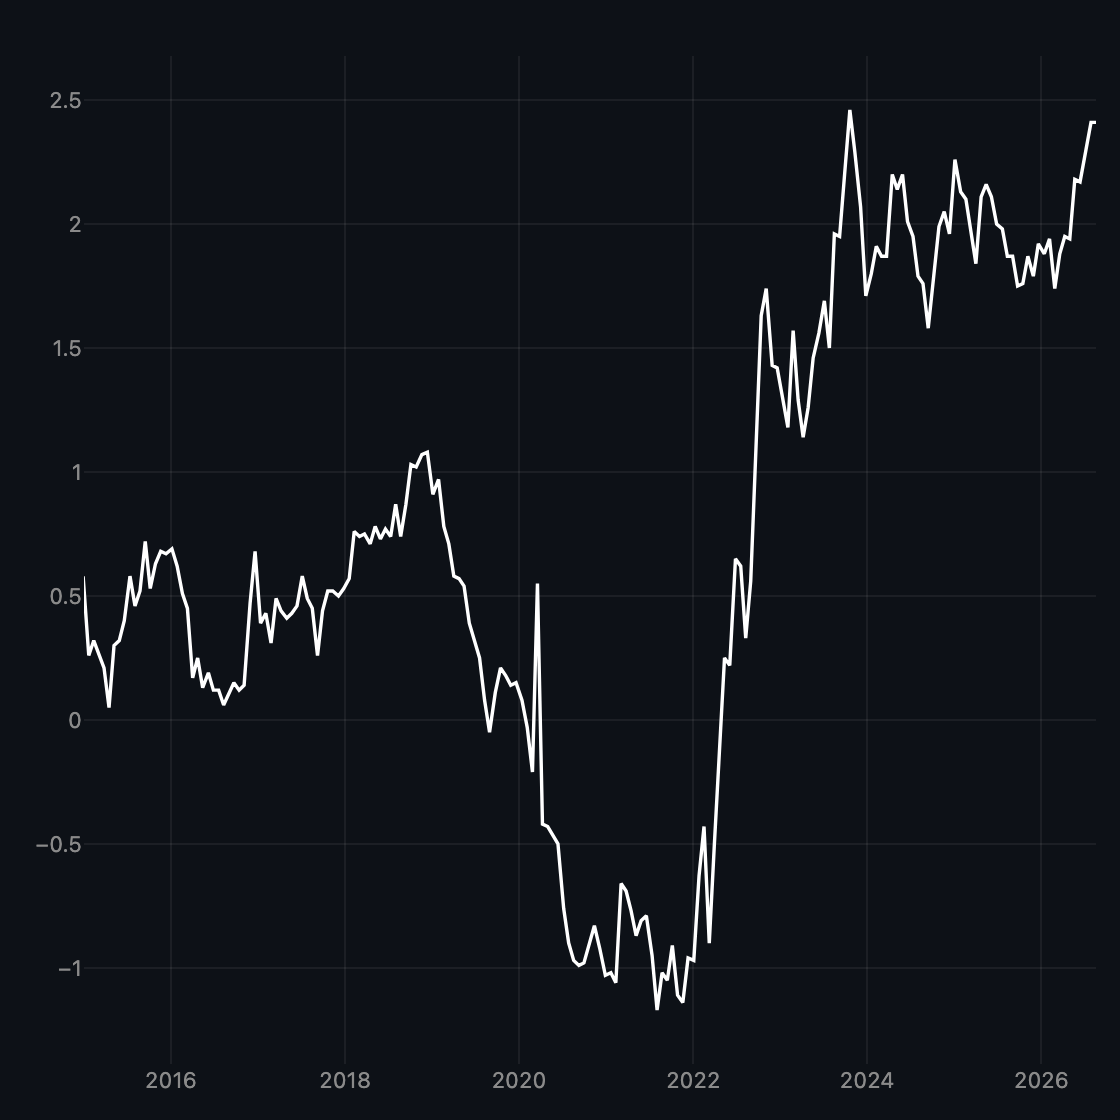
10-year TIPS real yield (DFII10).
-
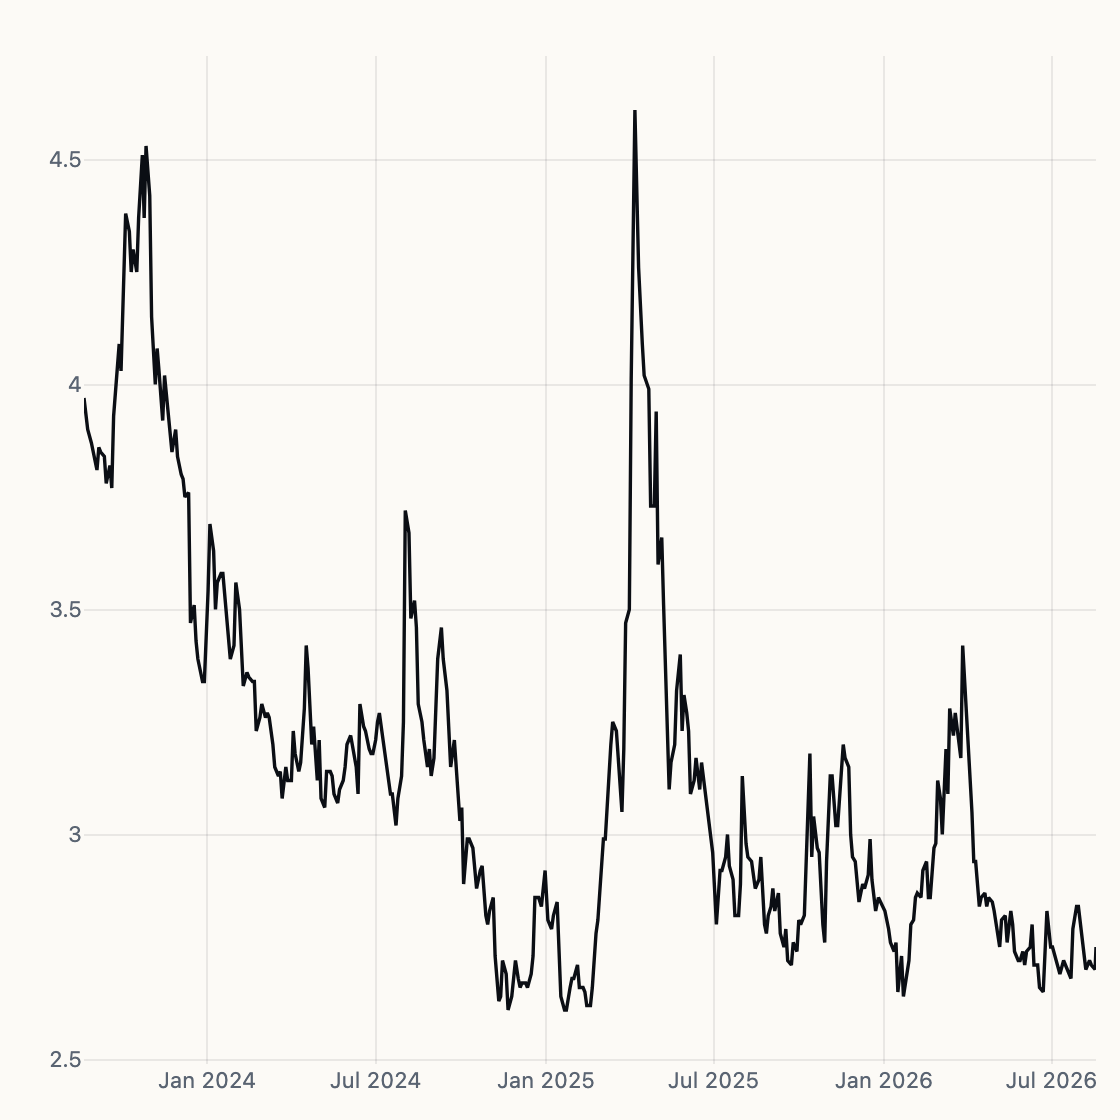
HY OAS
ICE BofA high-yield option-adjusted spread.
-
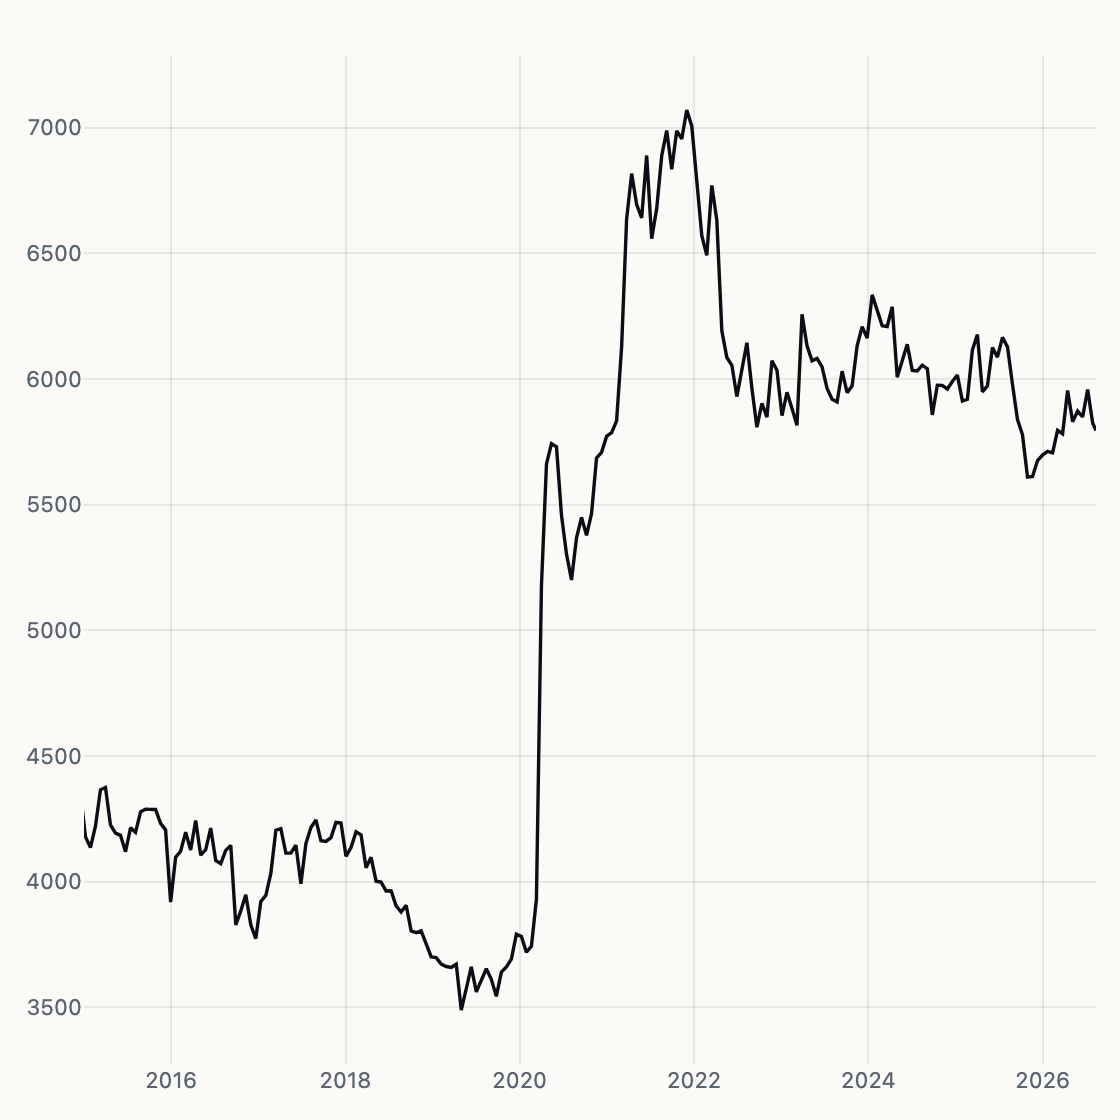
Net Liquidity
WALCL − TGA − RRP in billions of dollars.
-
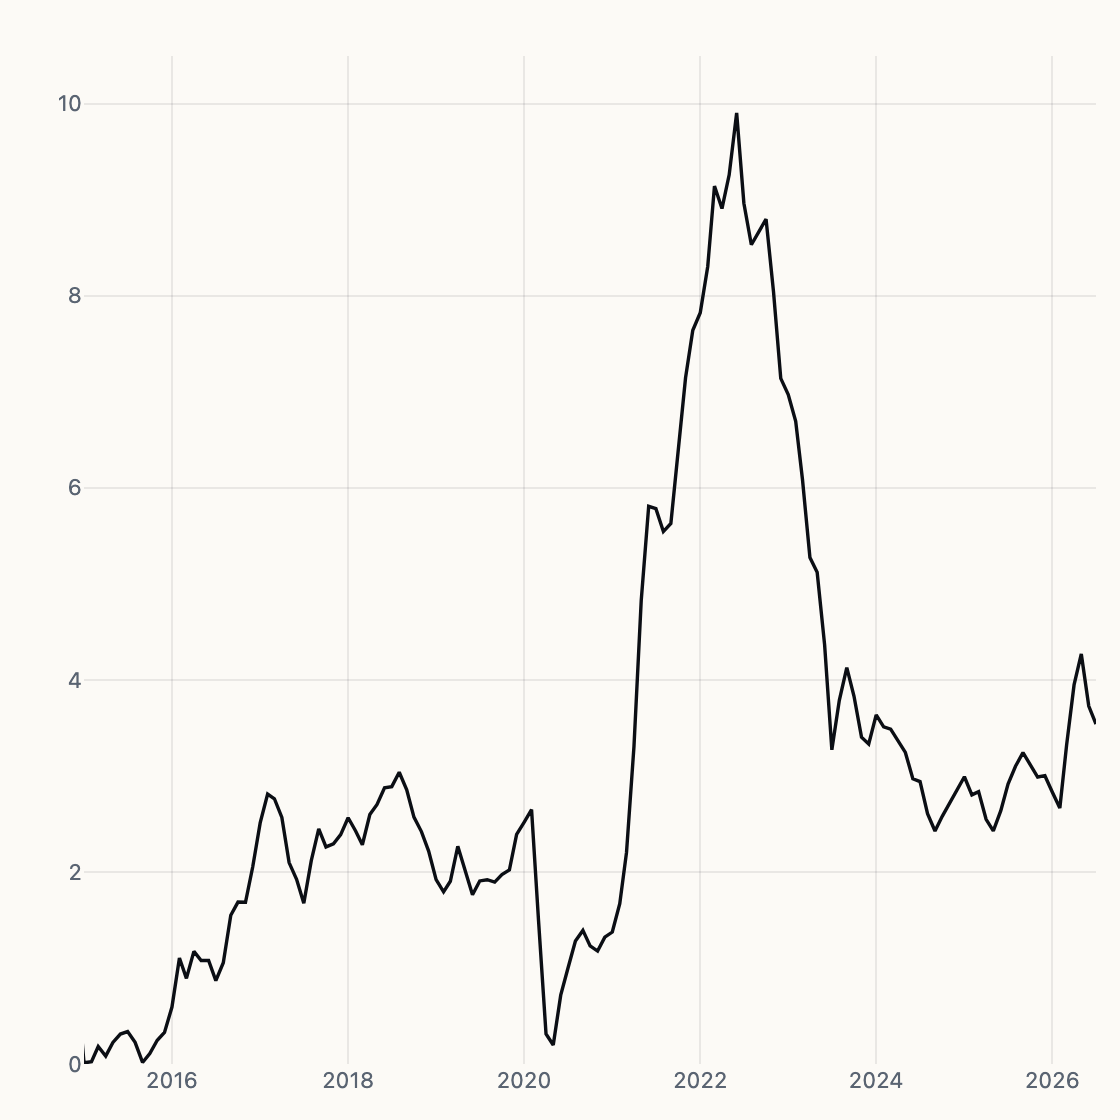
CPI YoY
CPIAUCSL year-over-year percent change.
-
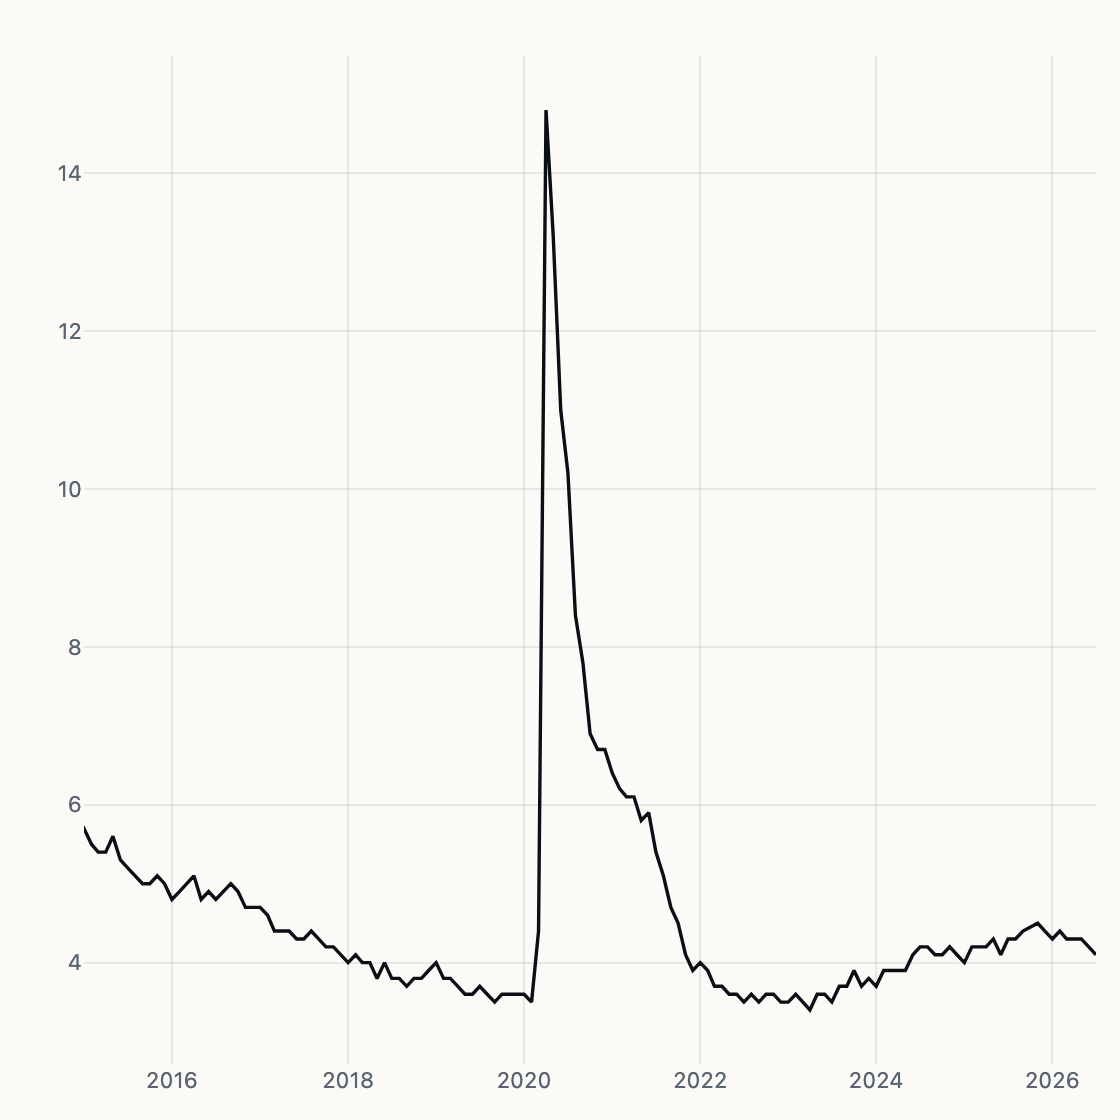
UNRATE
U-3 civilian unemployment rate.
-
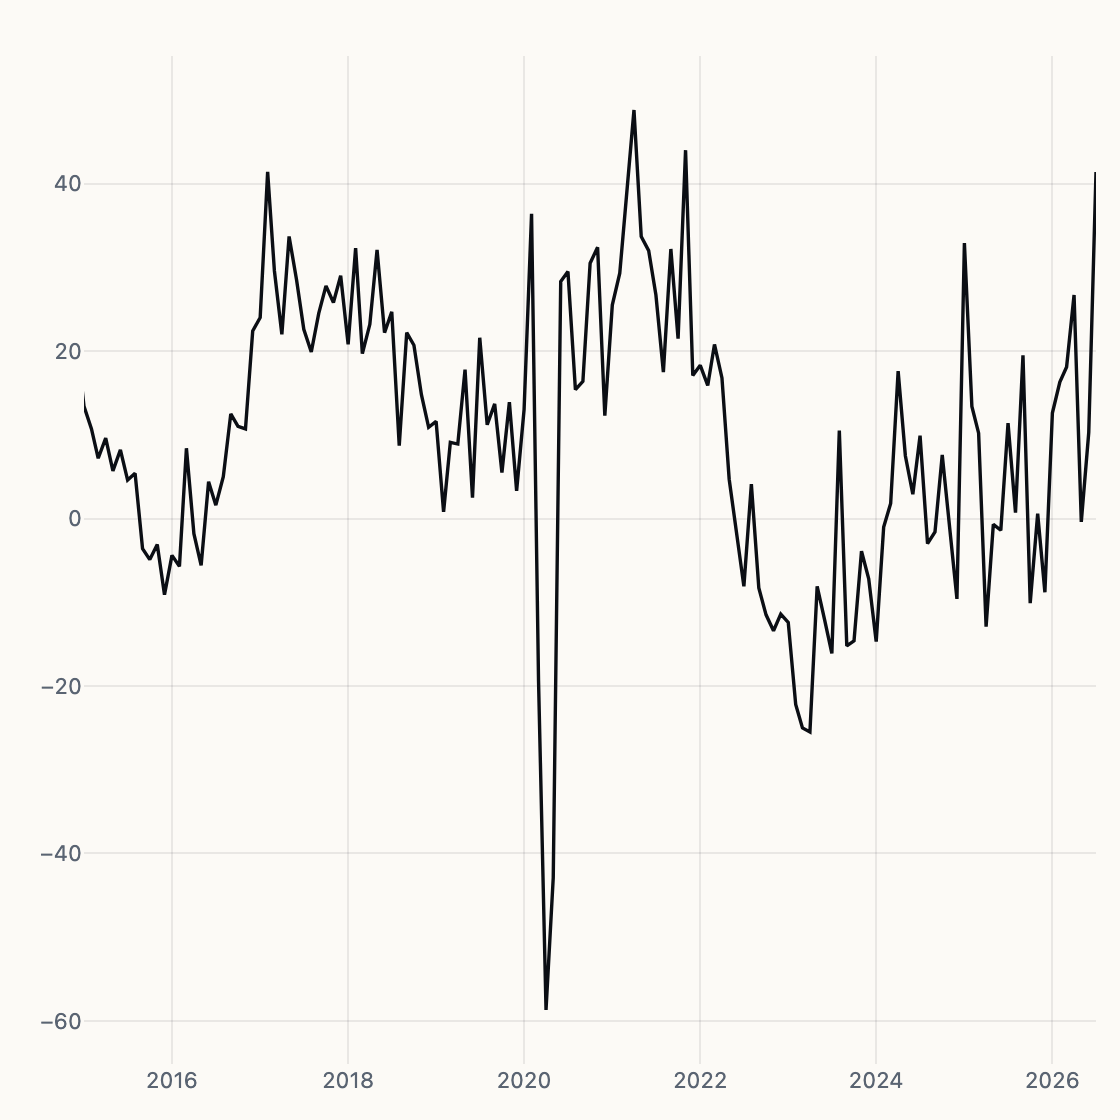
Philly Fed
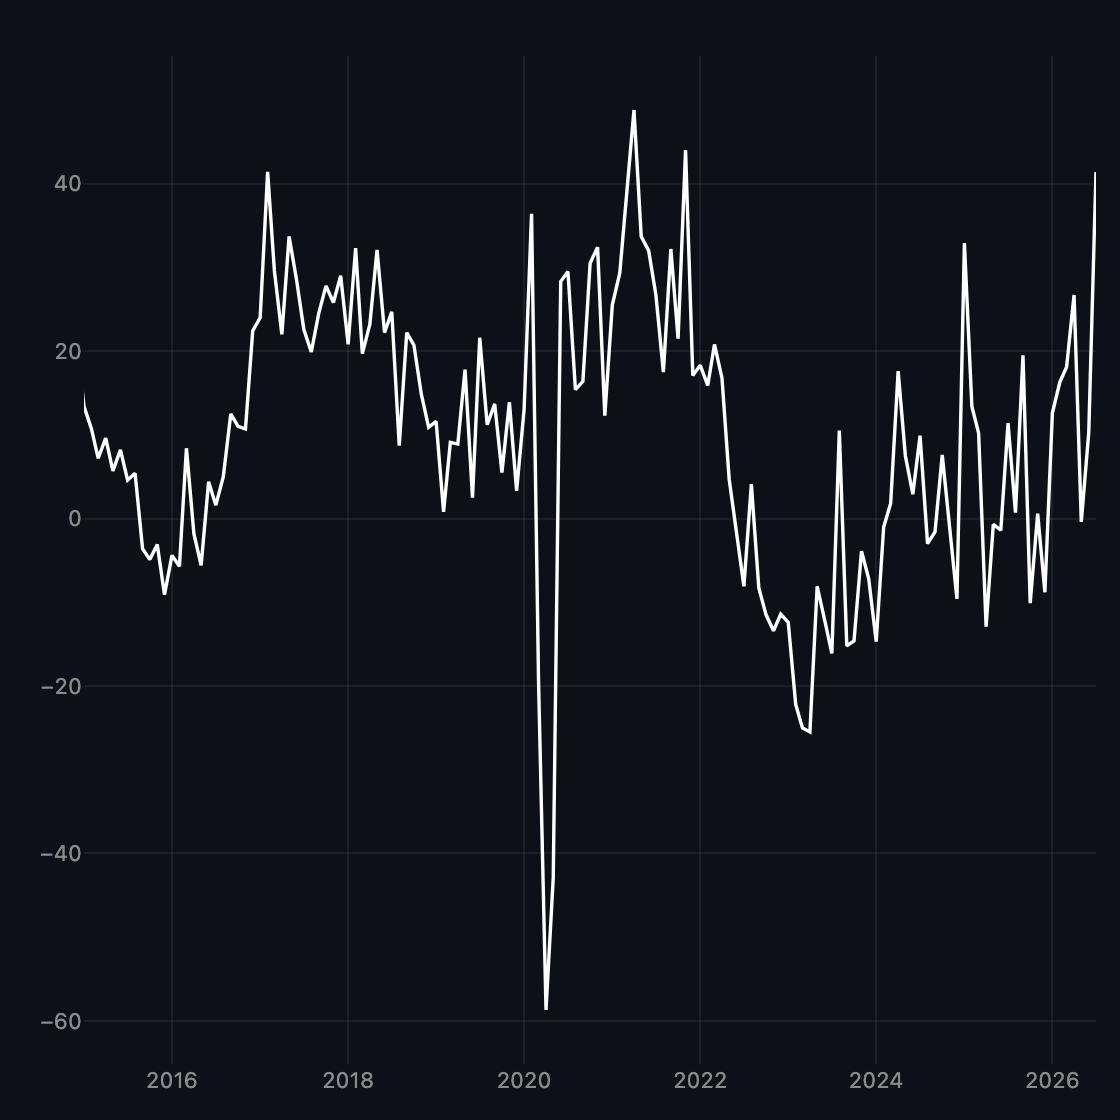
Philadelphia Fed manufacturing survey. Zero is flat.
-
LFPR vs 5Y
Labor-force participation vs the 5-year Treasury yield.
-

Overtime Z
Manufacturing overtime hours as a z-score.
-

ISM vs Workforce
ISM manufacturing vs the labor-force / workforce pulse.
-
ISM vs NFP
ISM manufacturing vs month-over-month payrolls.
-
ISM vs Lending
ISM manufacturing vs bank tightening / lending standards.
-
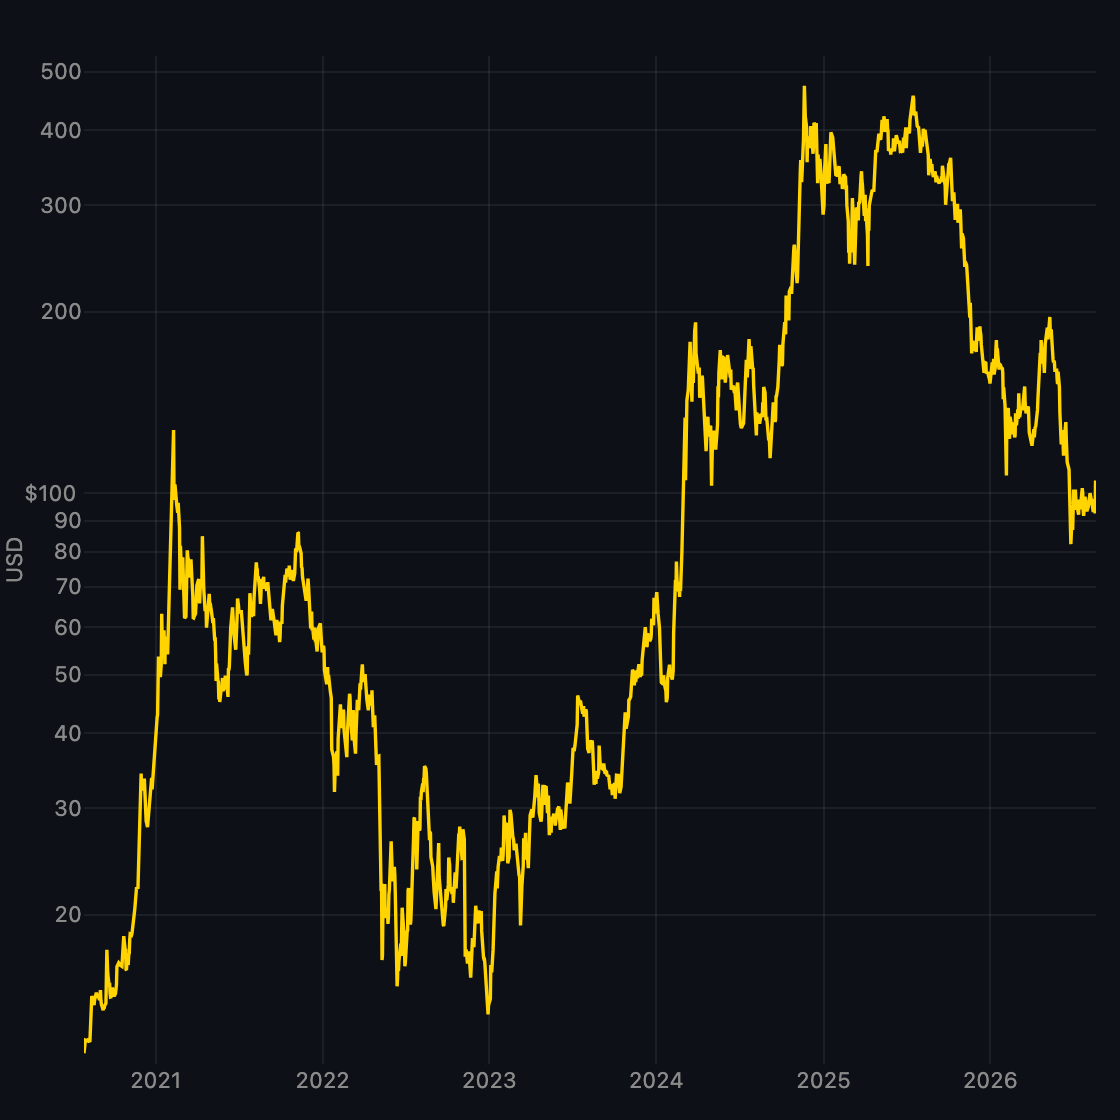
MSTR Spot
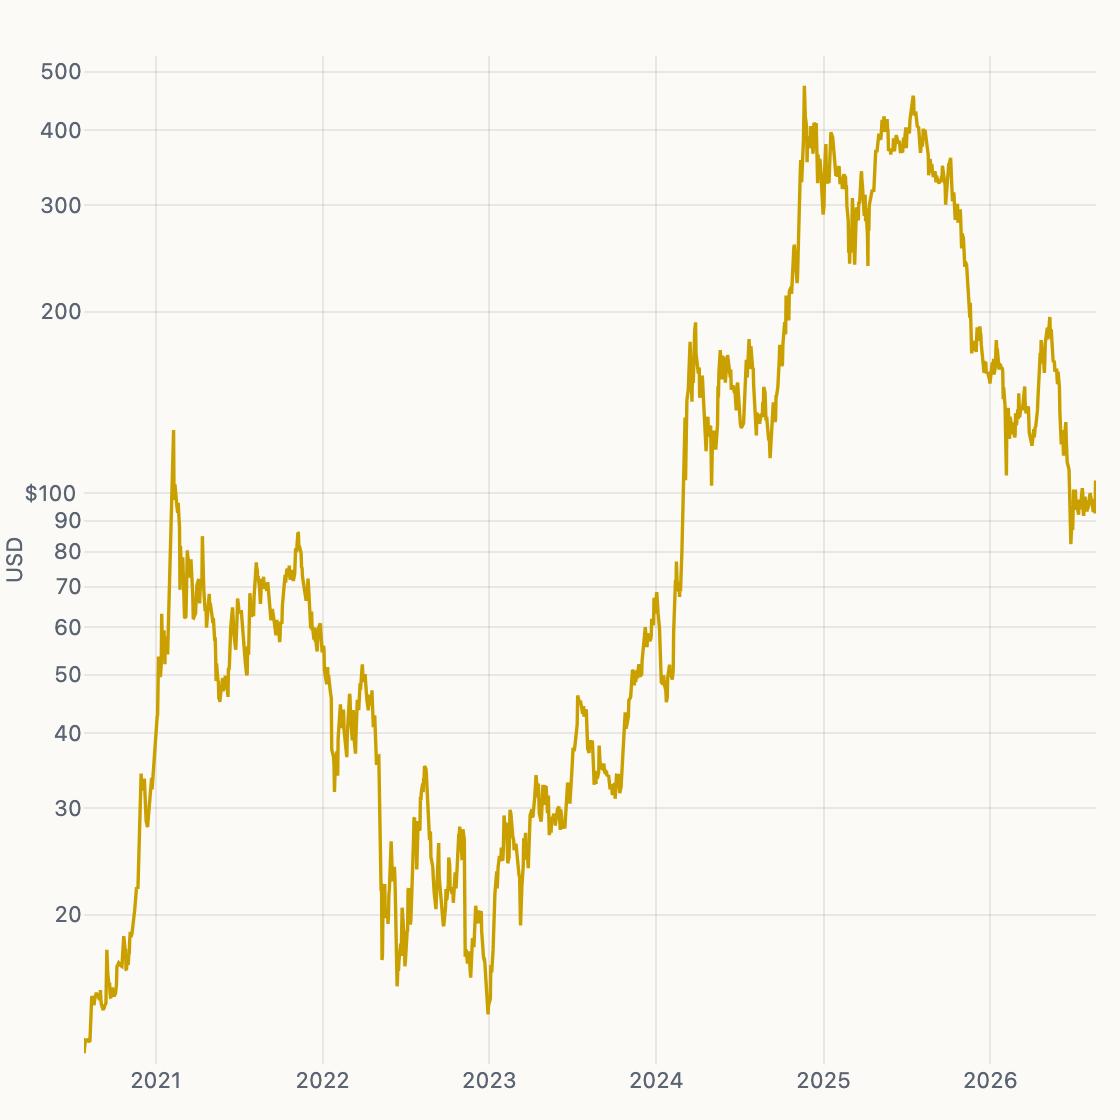
Strategy (MSTR) daily close since the Bitcoin treasury announcement.
-
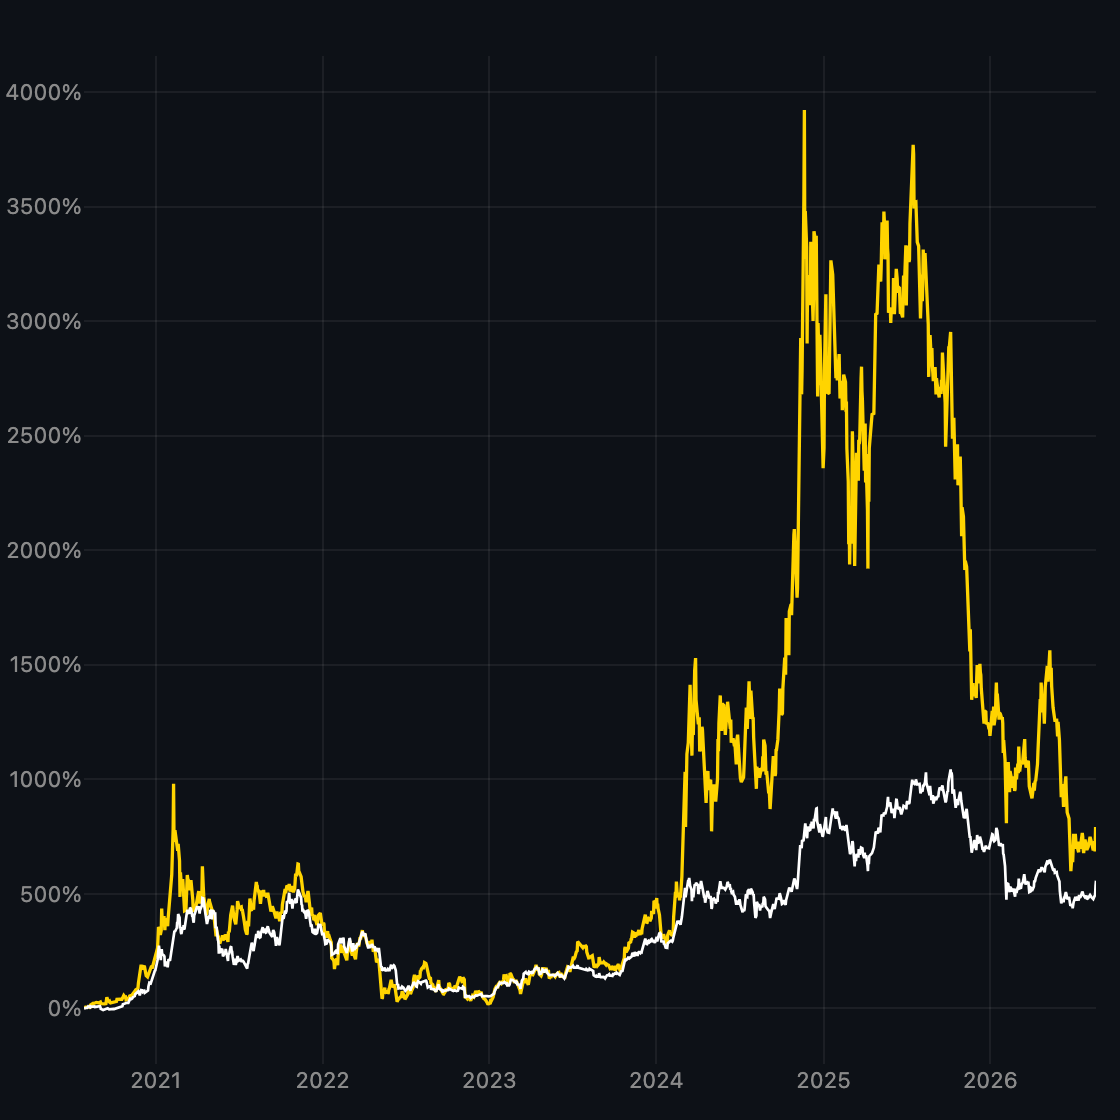
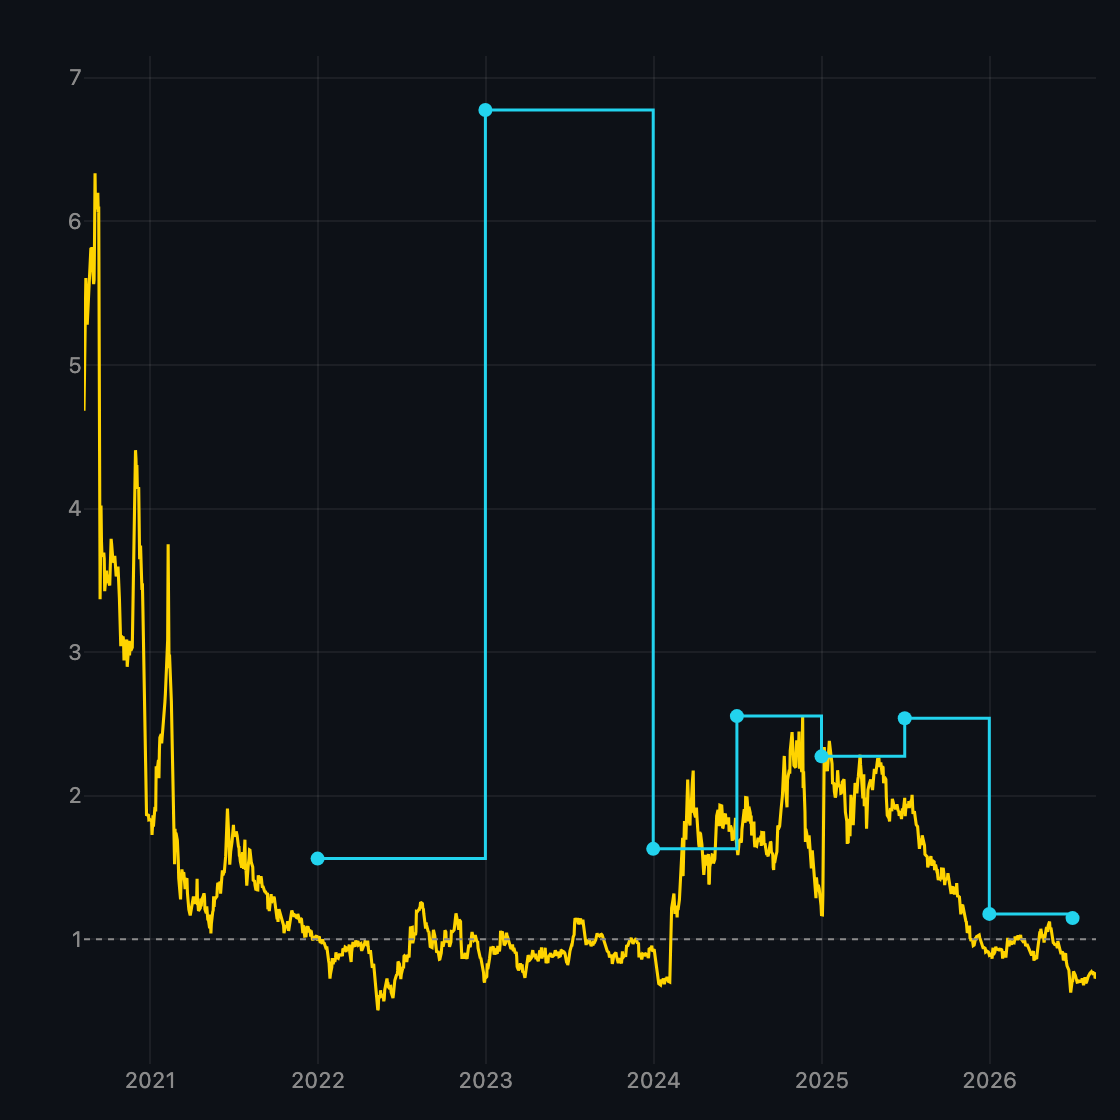
MSTR vs BTC
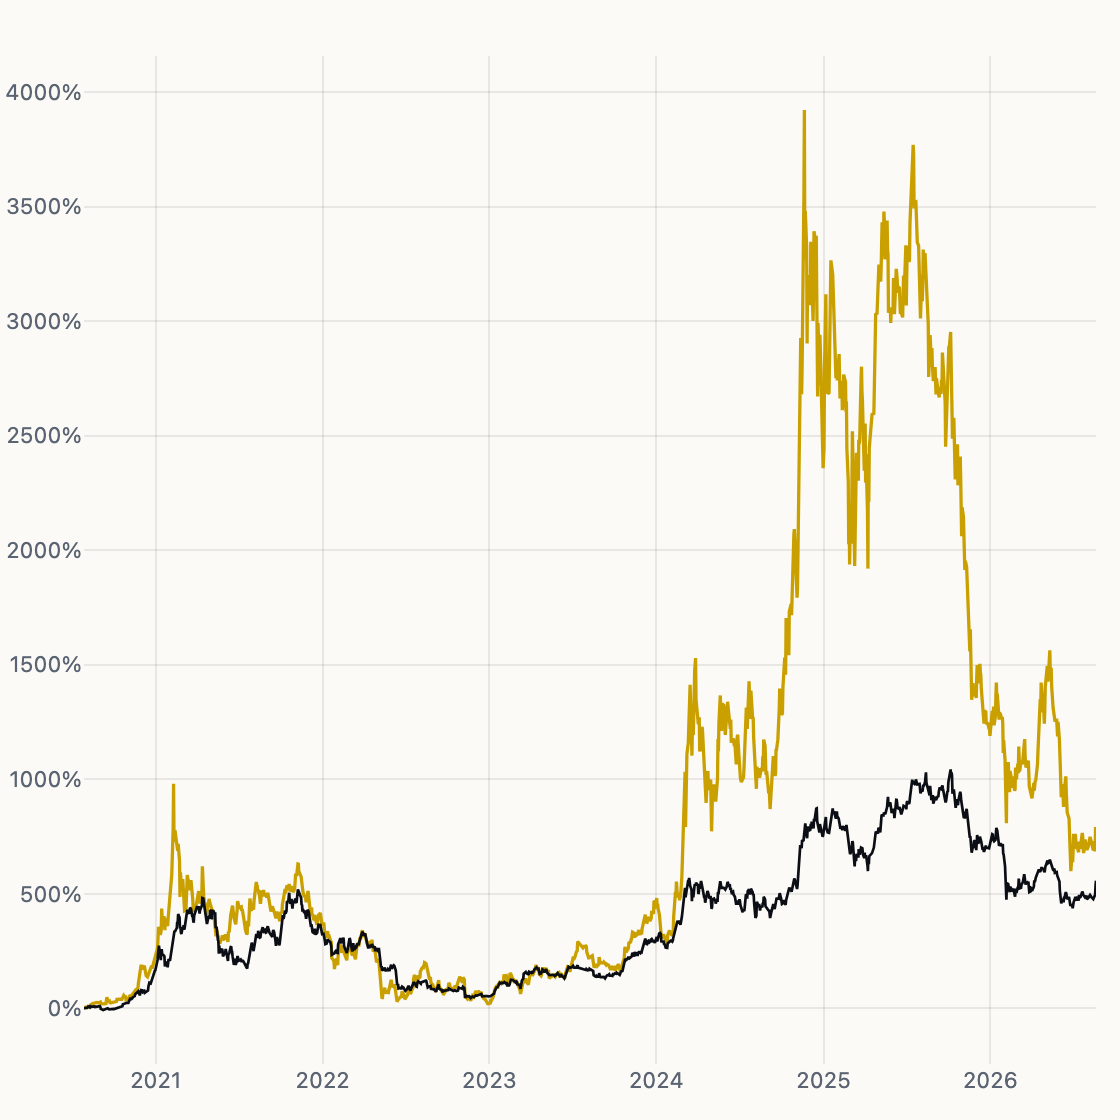
Total return of MSTR versus Bitcoin, indexed from overlap.
-
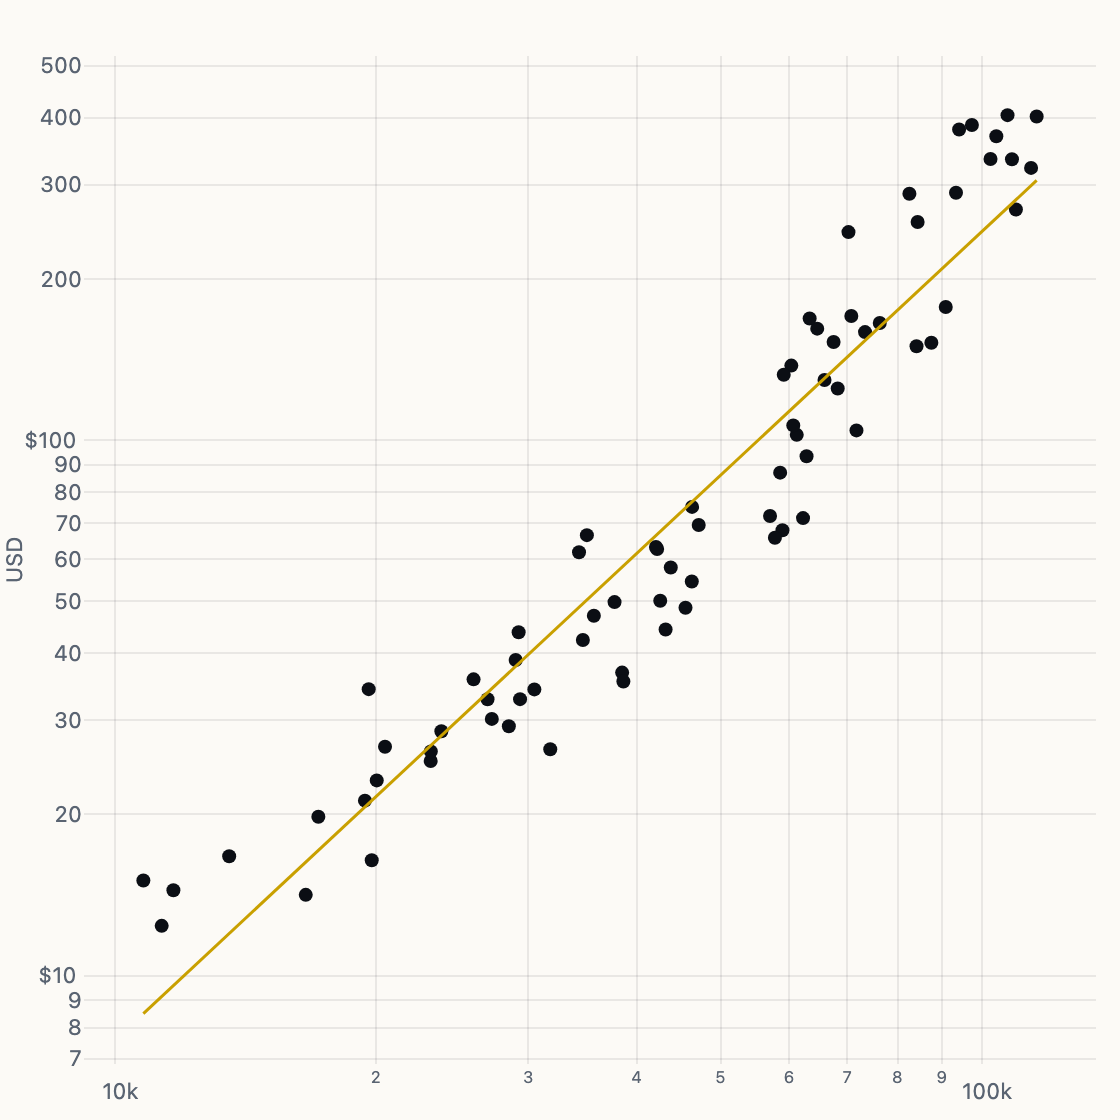
MSTR BTC Beta
Monthly log-log OLS: implied beta of MSTR to Bitcoin.
-
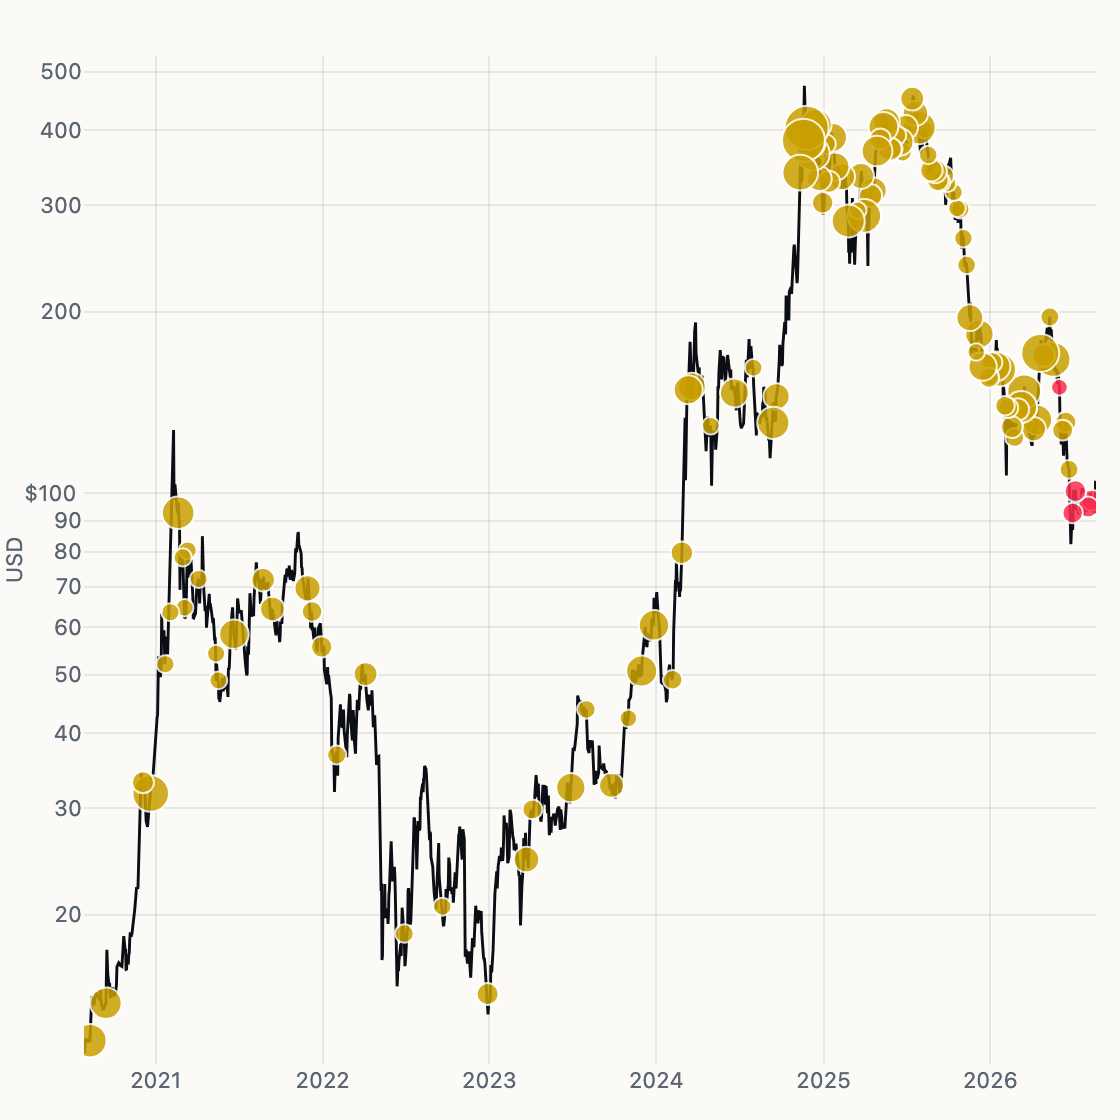
Buy / Sell Tape
MSTR spot with treasury buy and sell markers sized by BTC.
-
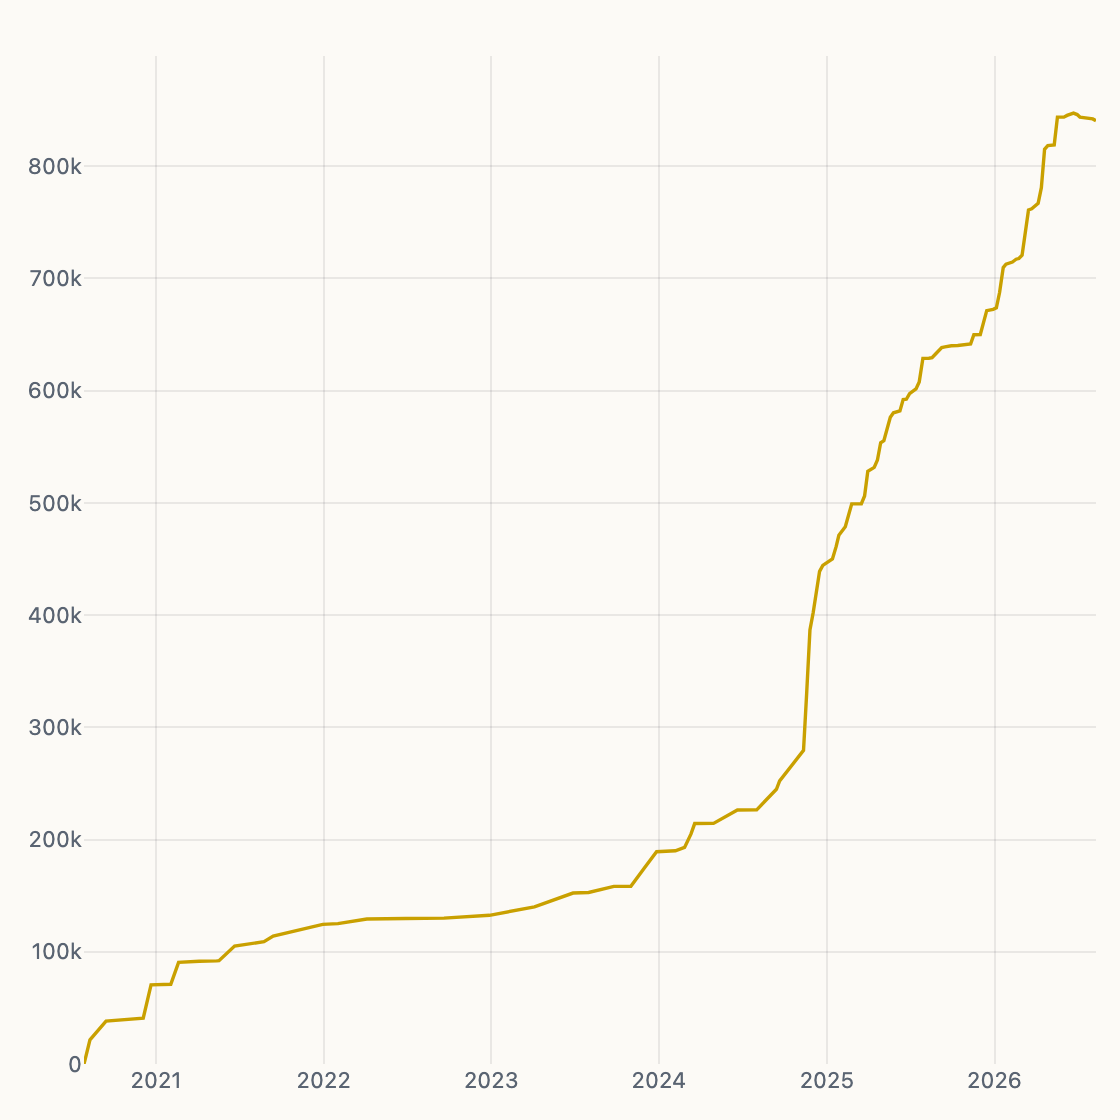
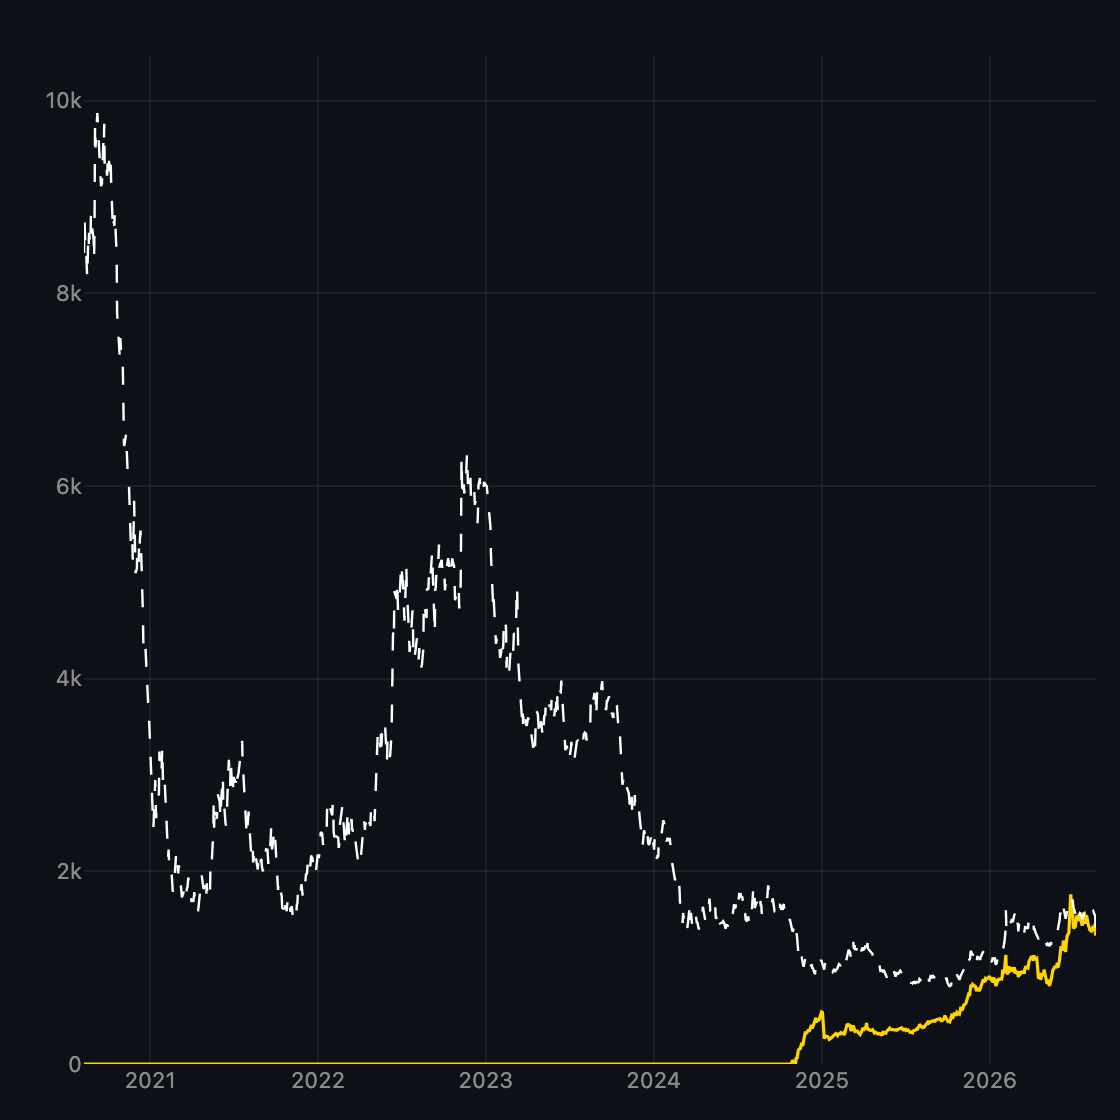
BTC Stack
Bitcoin holdings on the Strategy balance sheet.
-
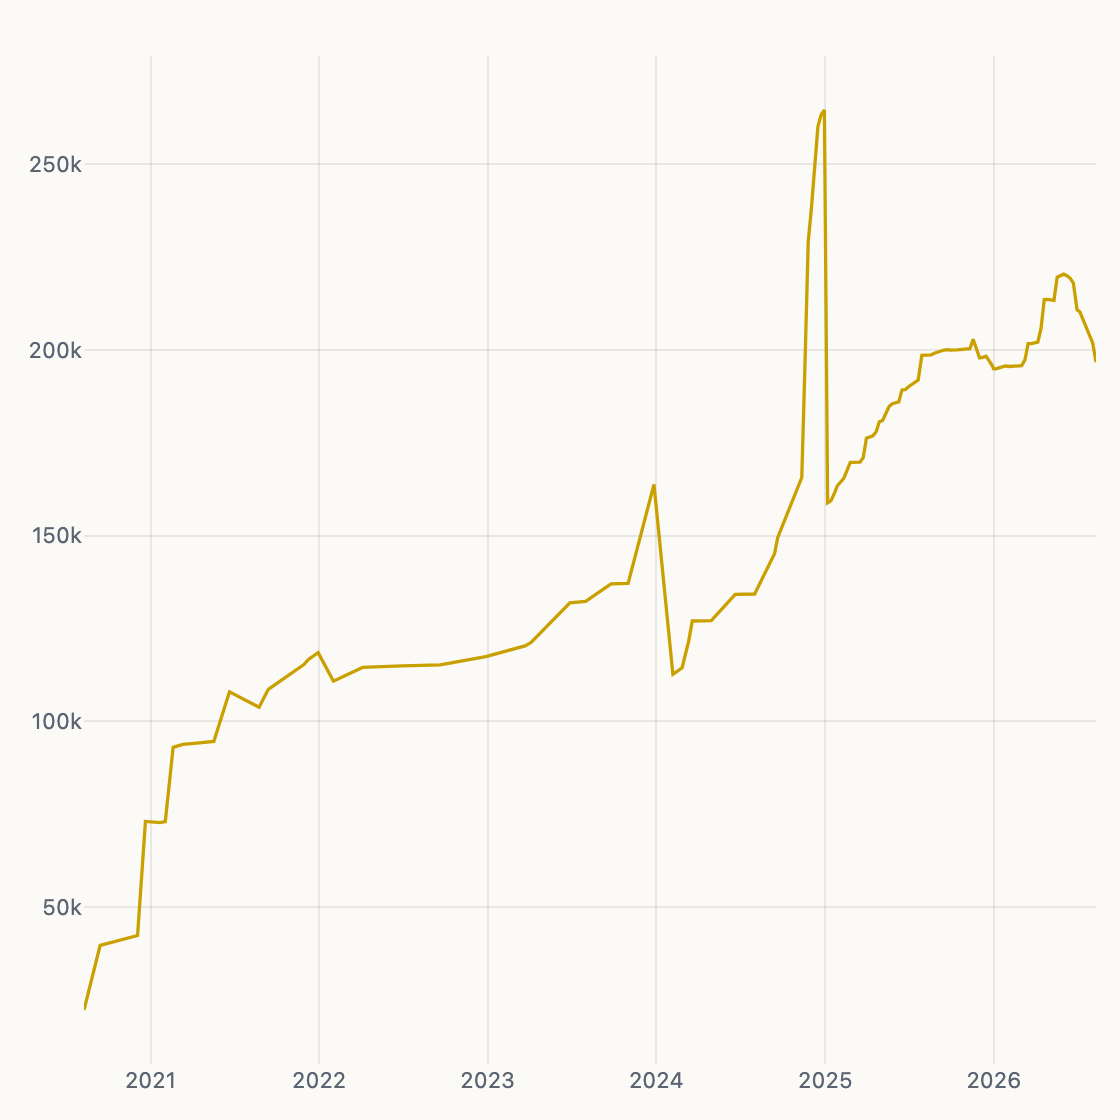
BTC / Share
Sats per share — gross BTC per diluted share.
-
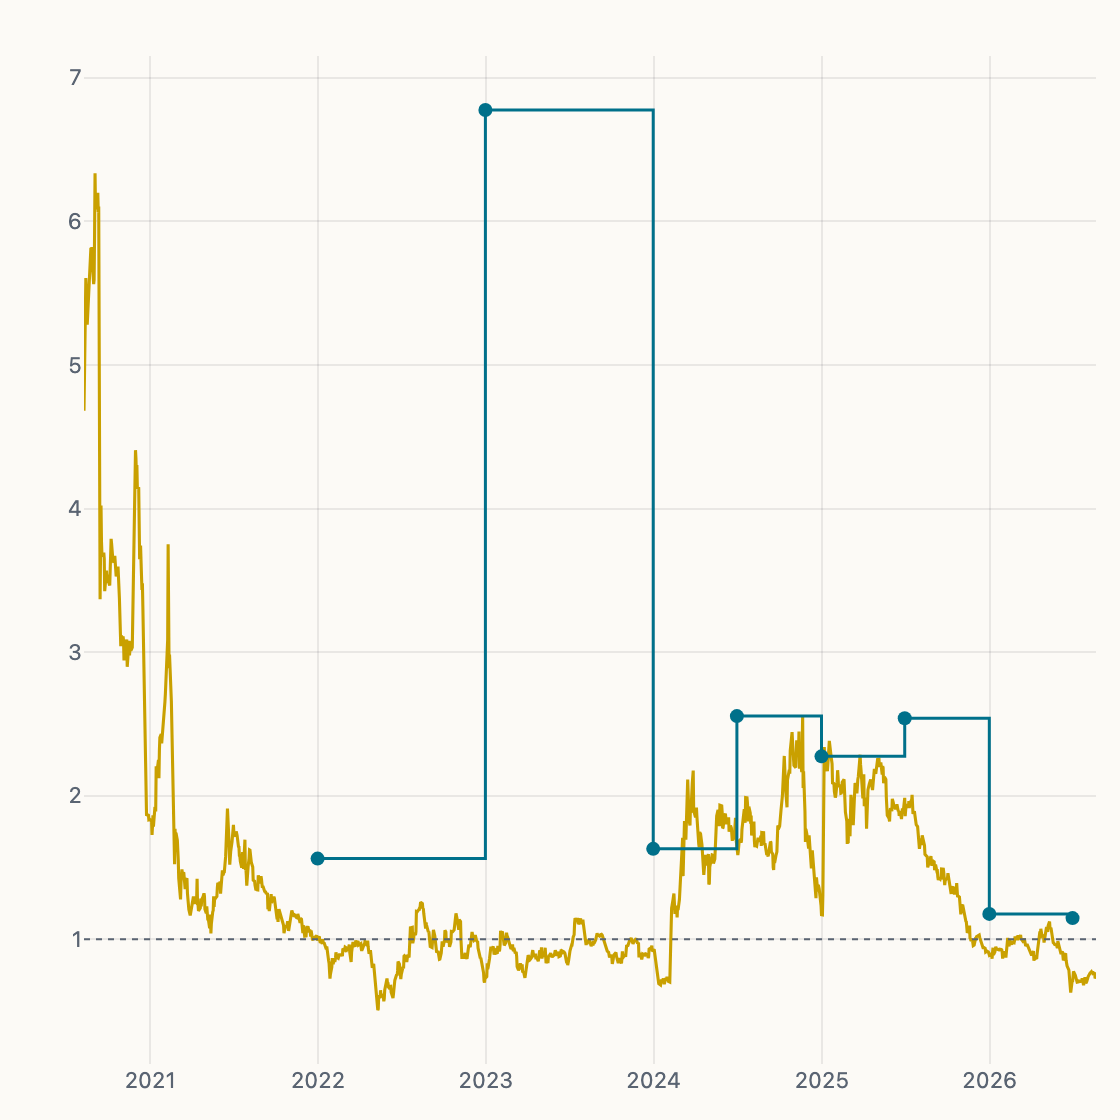
mNAV History
Gross mNAV (price ÷ BPS × BTC) with quarterly net steps.
-
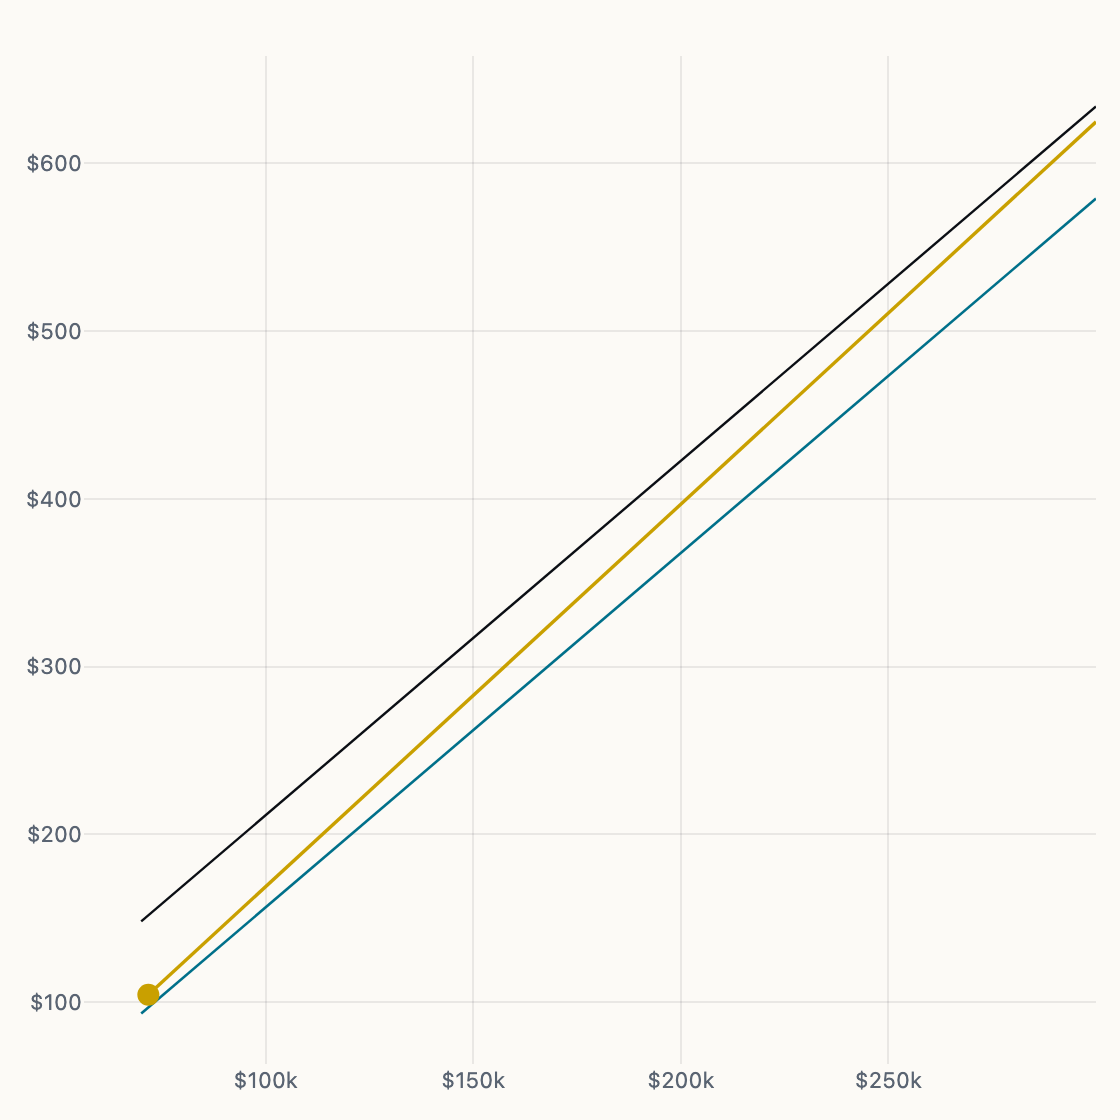
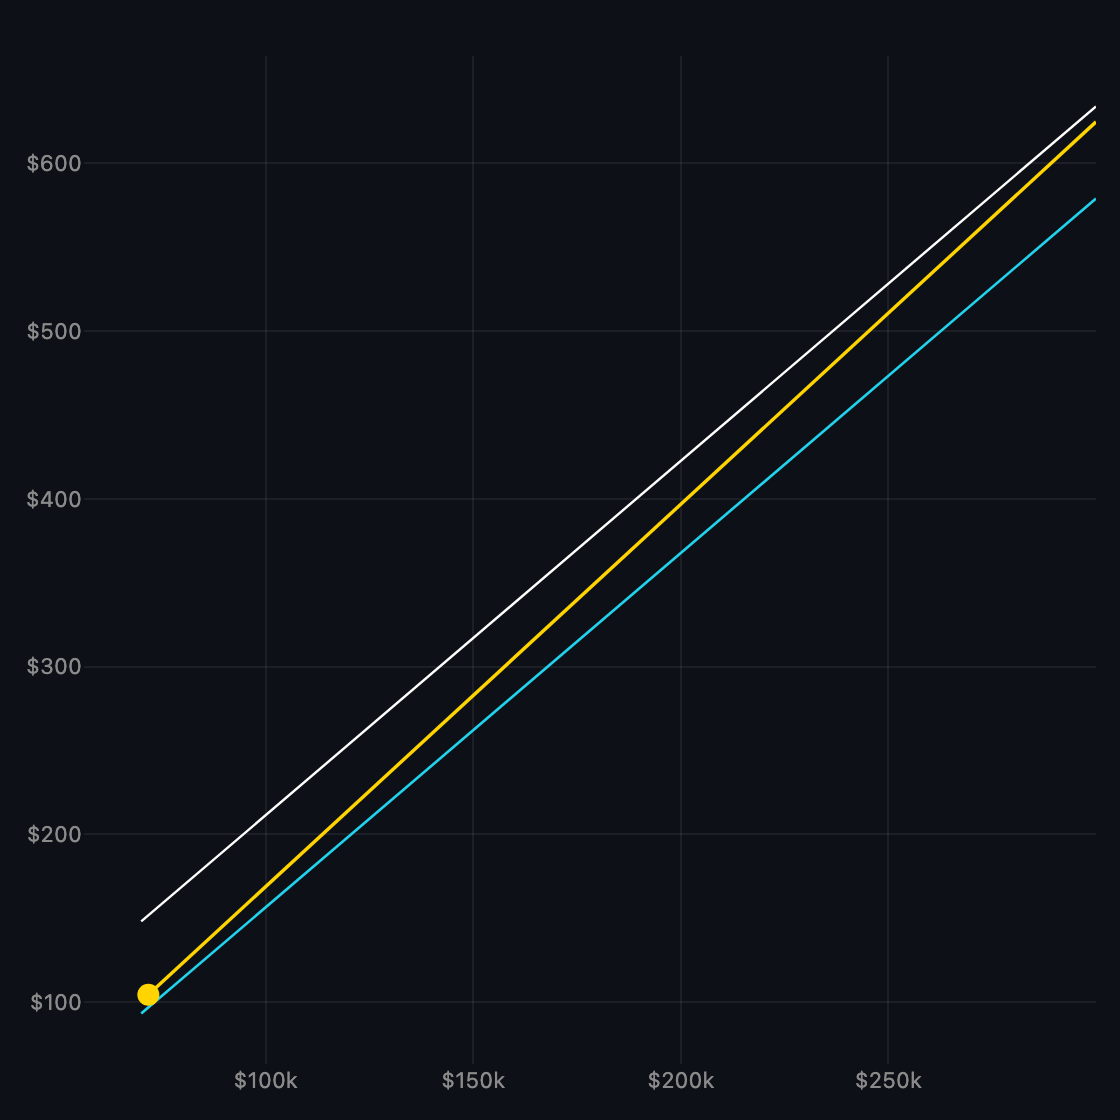
Implied MSTR
NAV-identity implied equity price across a BTC ladder.
-
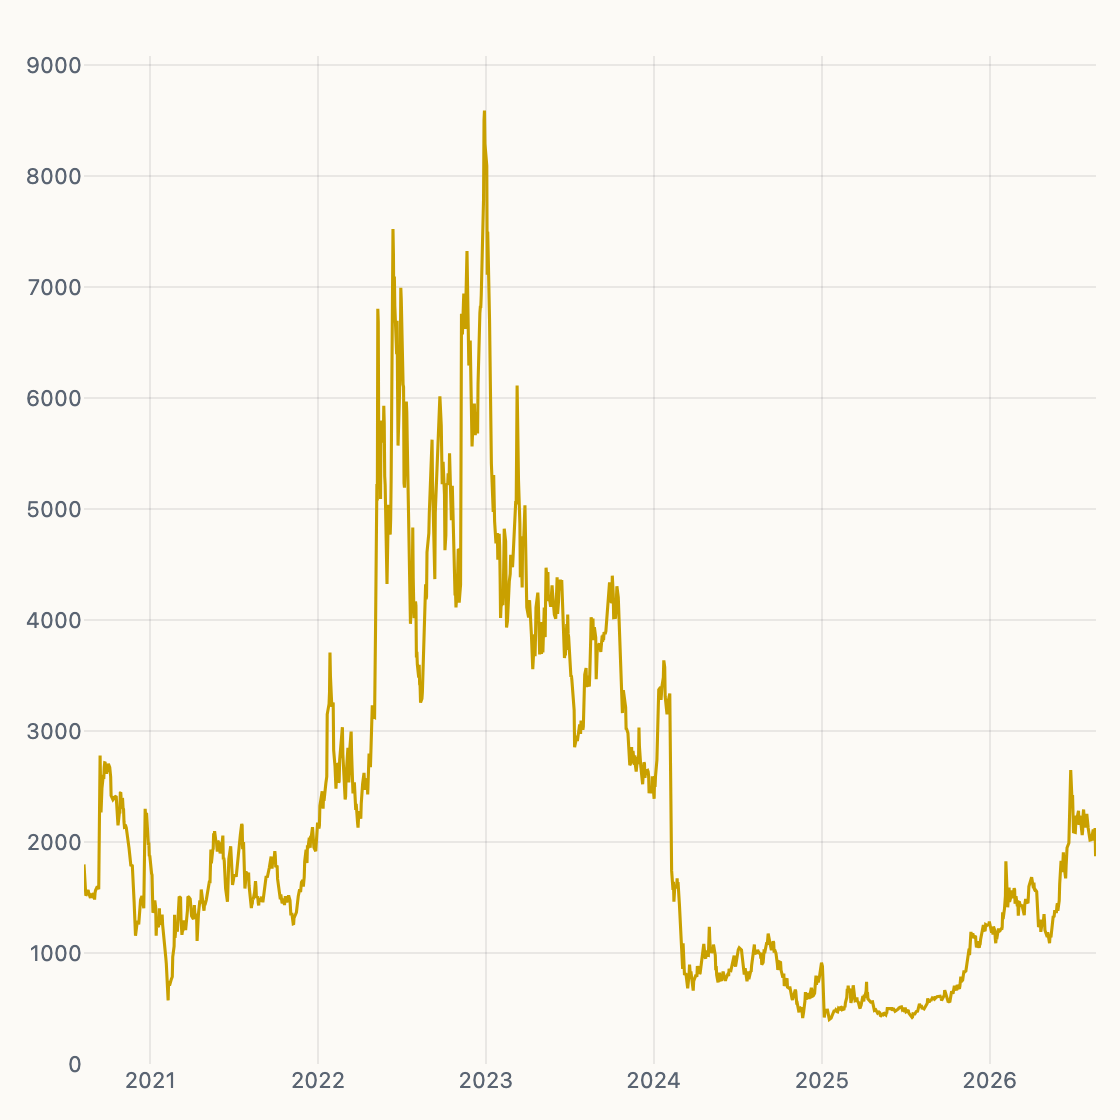
Sats / $1
Gross treasury sats per dollar of equity market cap.
-
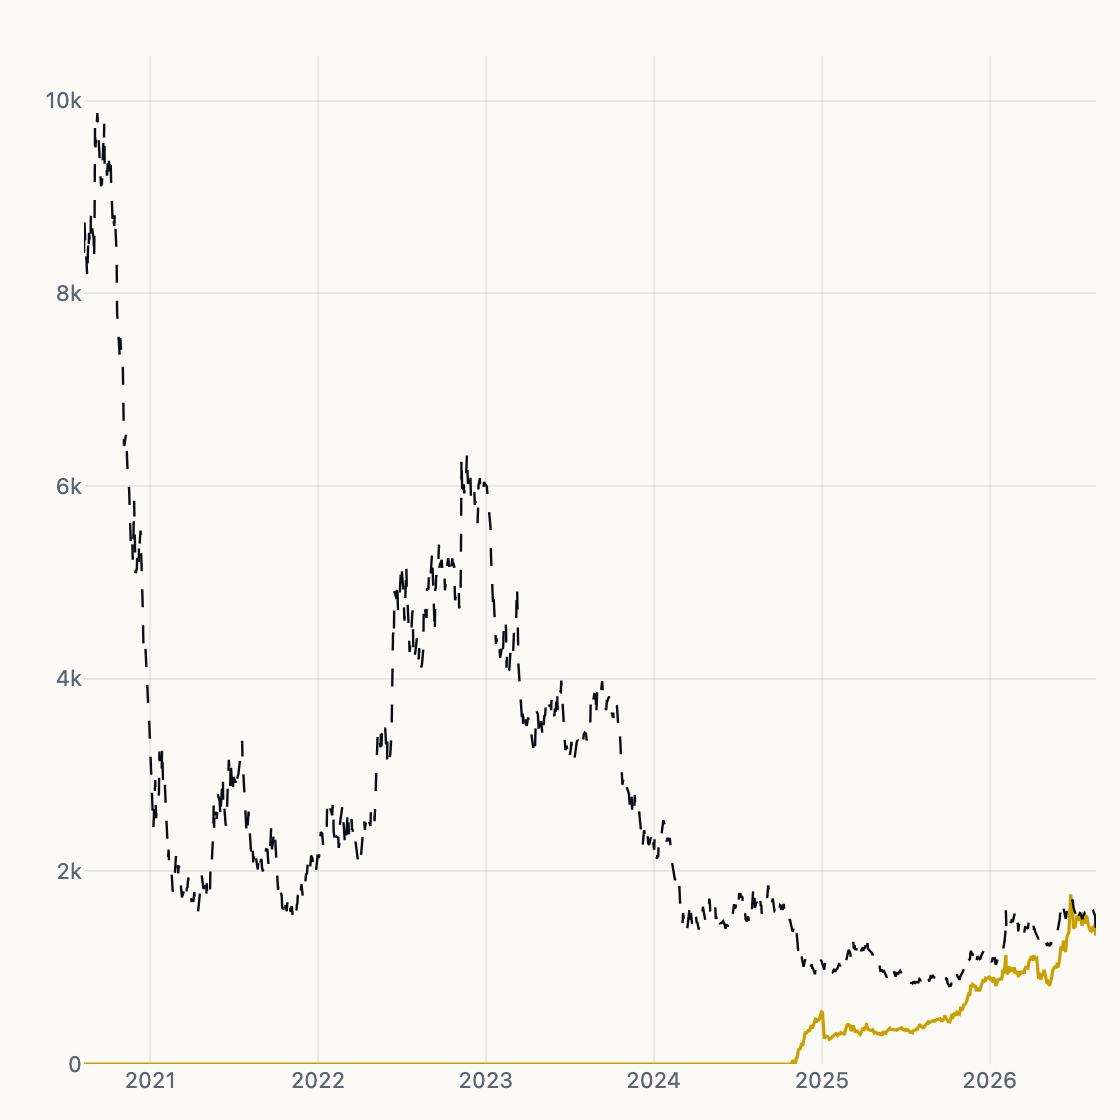
Net Sats / $1
Residual sats after debt + preferred − cash, vs spot BTC.
-
Pref vs BTC
Preferred yields versus Bitcoin’s 1-year return and hurdle ARR.
-
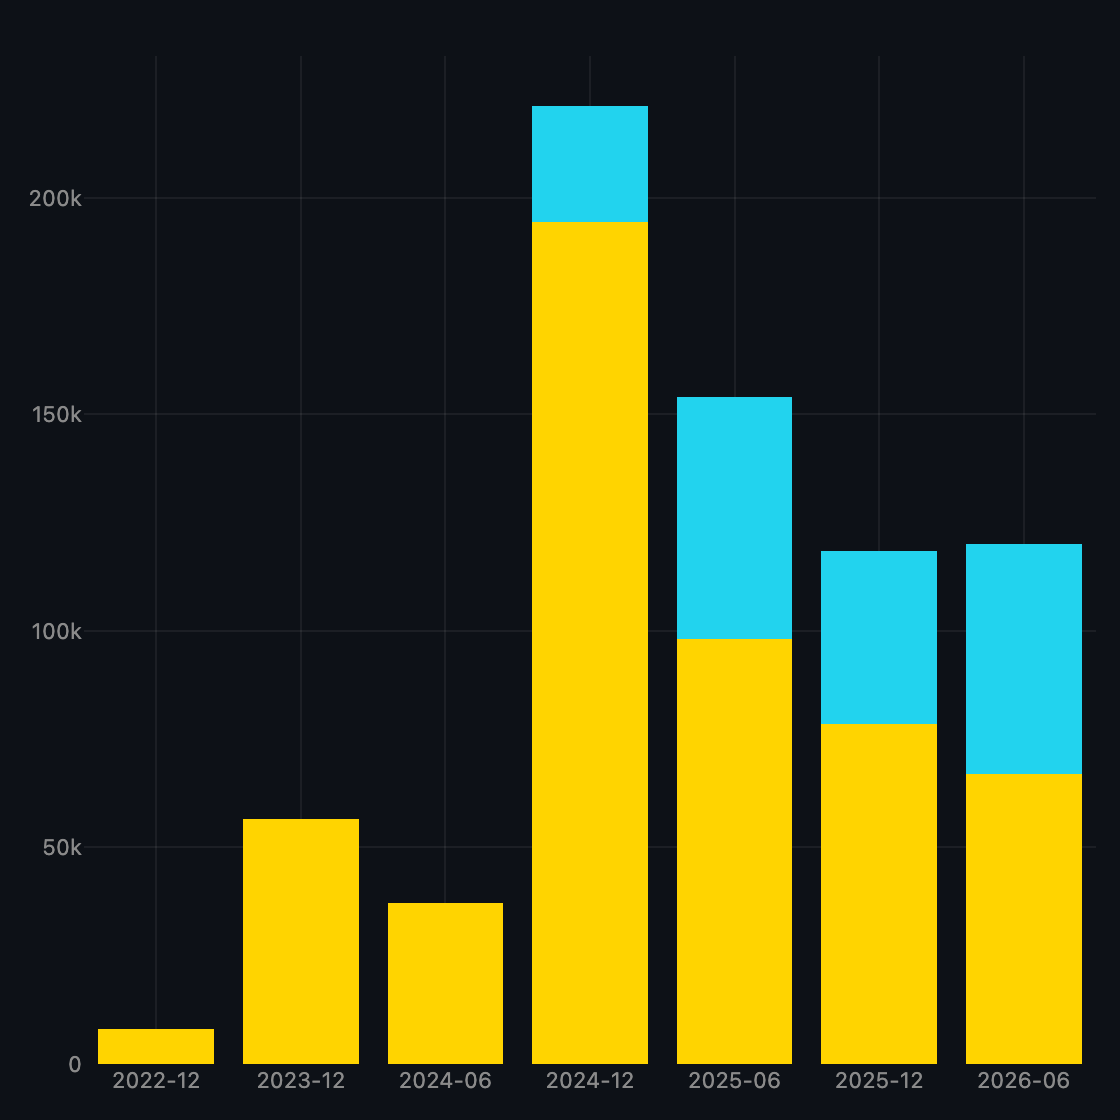
Issuance Decomp
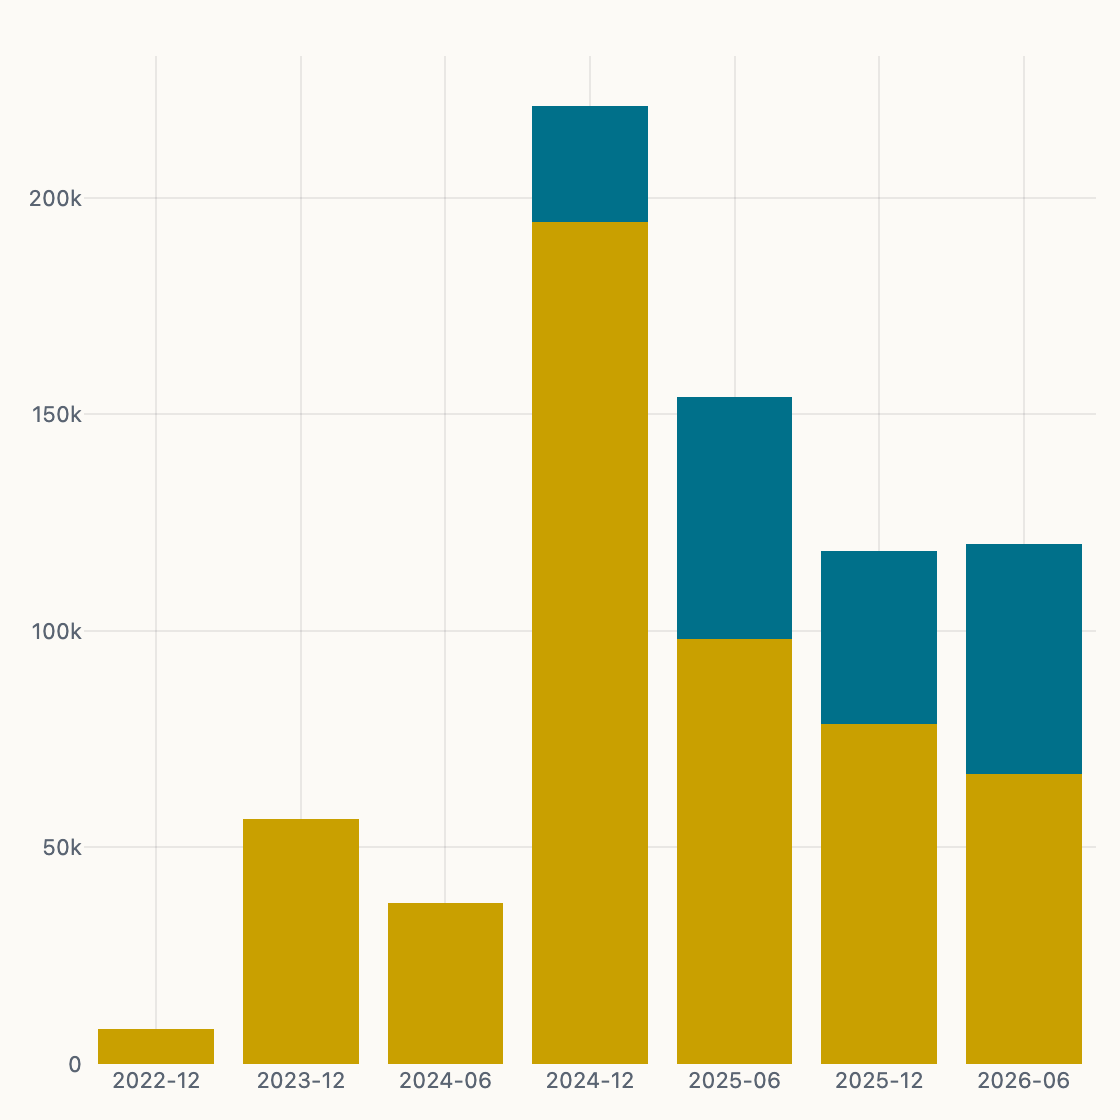
Implied ATM vs preferred vs other BTC additions.
-
Coverage / Carry
USD-reserve dividend coverage in years.
-
CEBE Rank
Ranked by net / CEBE mNAV: residual Bitcoin left for common after debt and preferreds. Gross mNAV is the headline that lies.
-
mNAV
Market NAV multiple across rankable Bitcoin treasury issuers.
-
Net Sats / $
Residual sats per equity dollar vs the spot-BTC control.
-
Yield vs Carry
BTC yield versus blended preferred/debt carry — above the diagonal is accretive.
-
Amp vs mNAV
Balance-sheet amplification versus mNAV for each issuer.
-
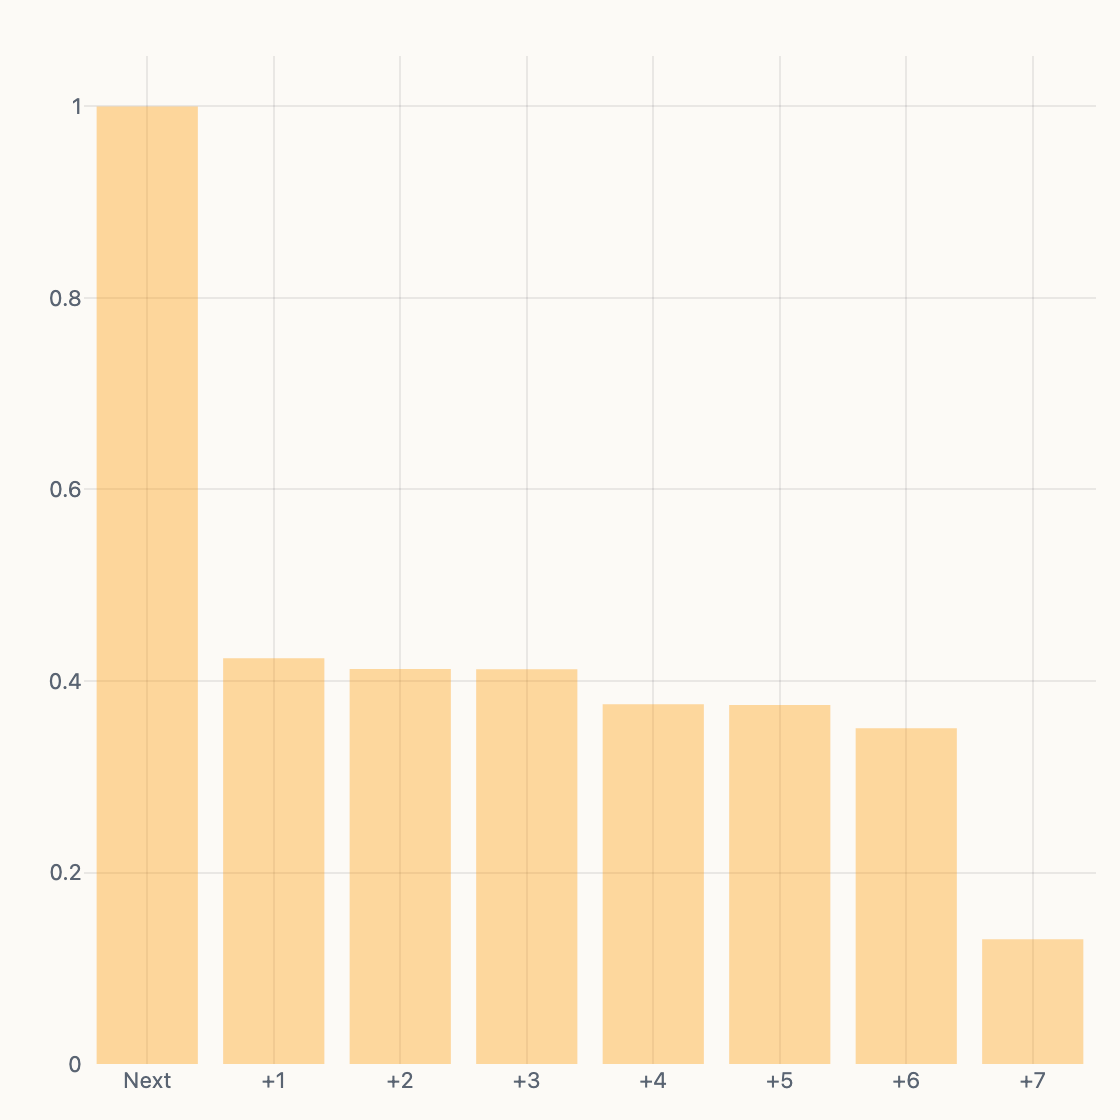
Mempool
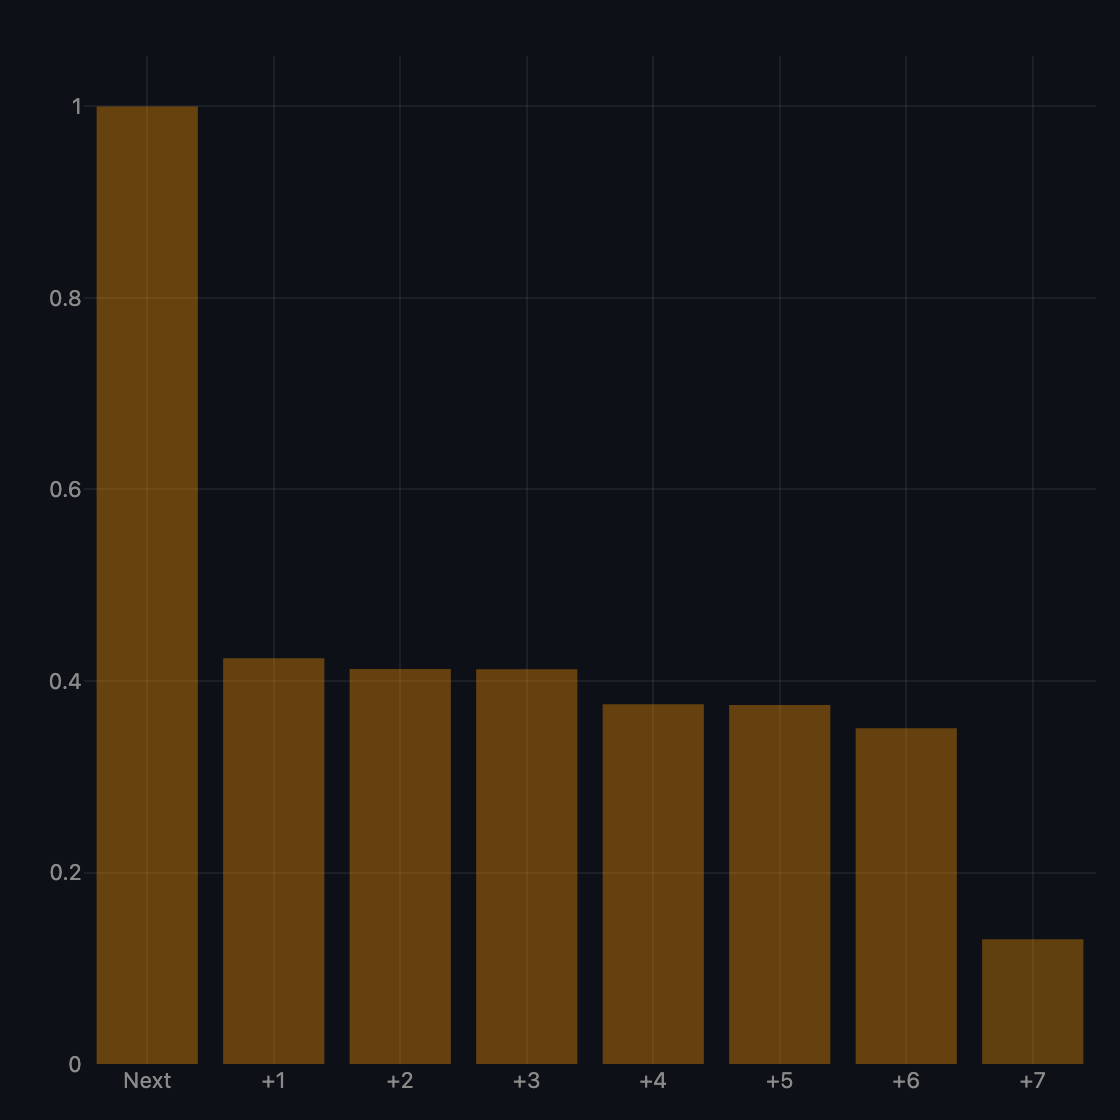
Median fee by projected next block after NOW.
-
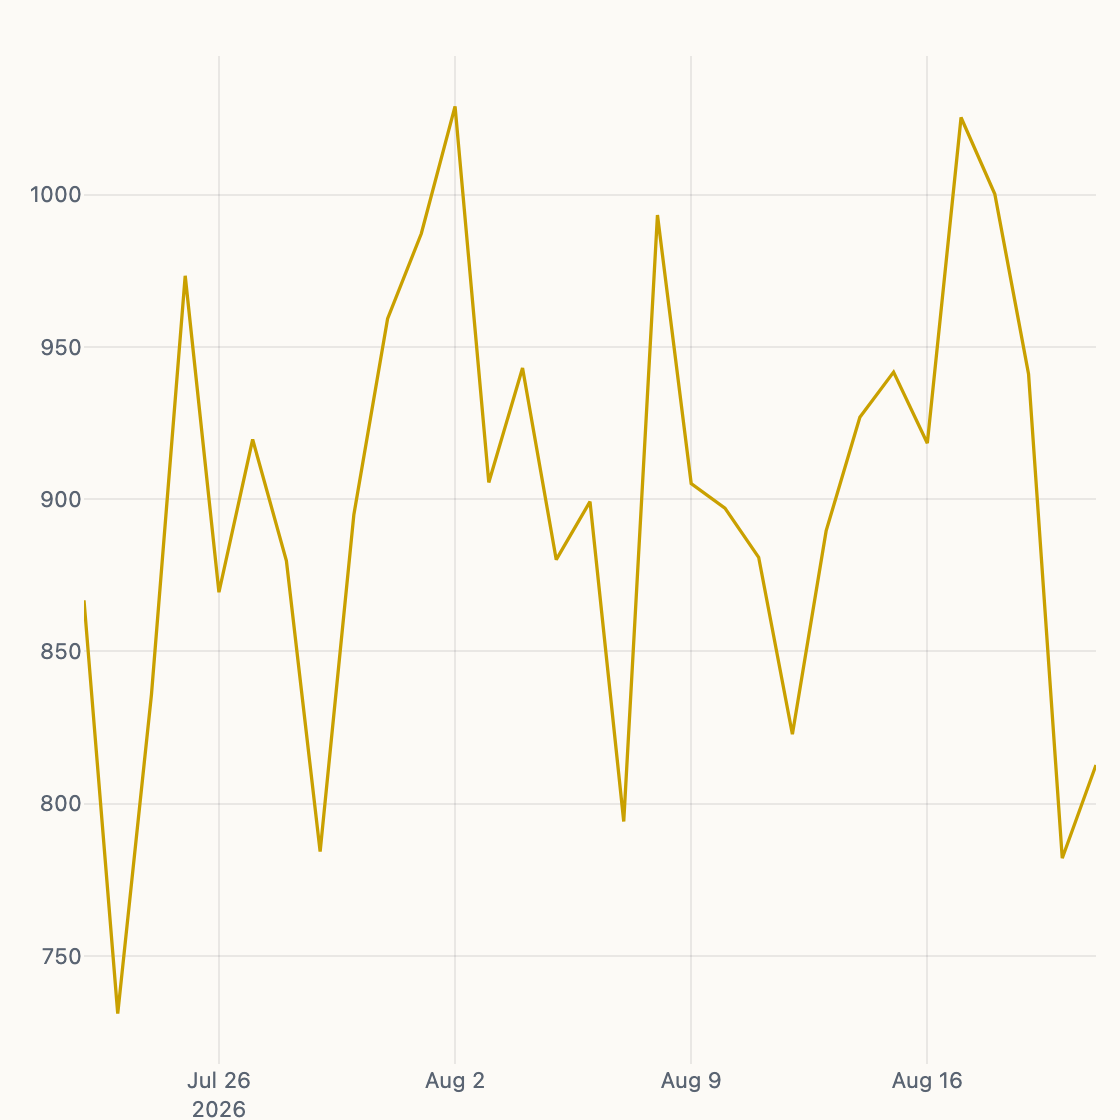
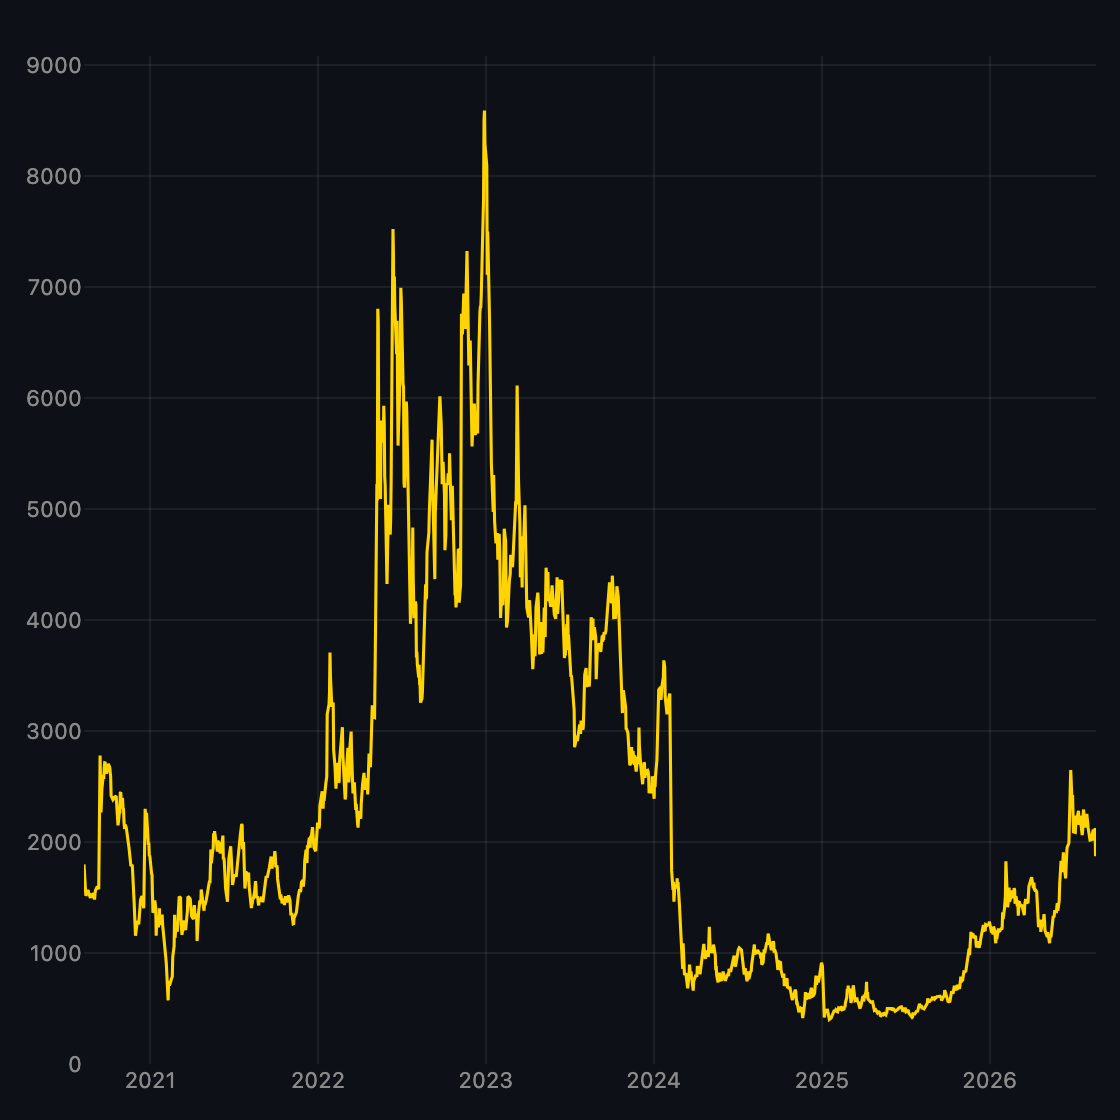
Hashrate
Network hashrate (EH/s) and difficulty-epoch context.
-
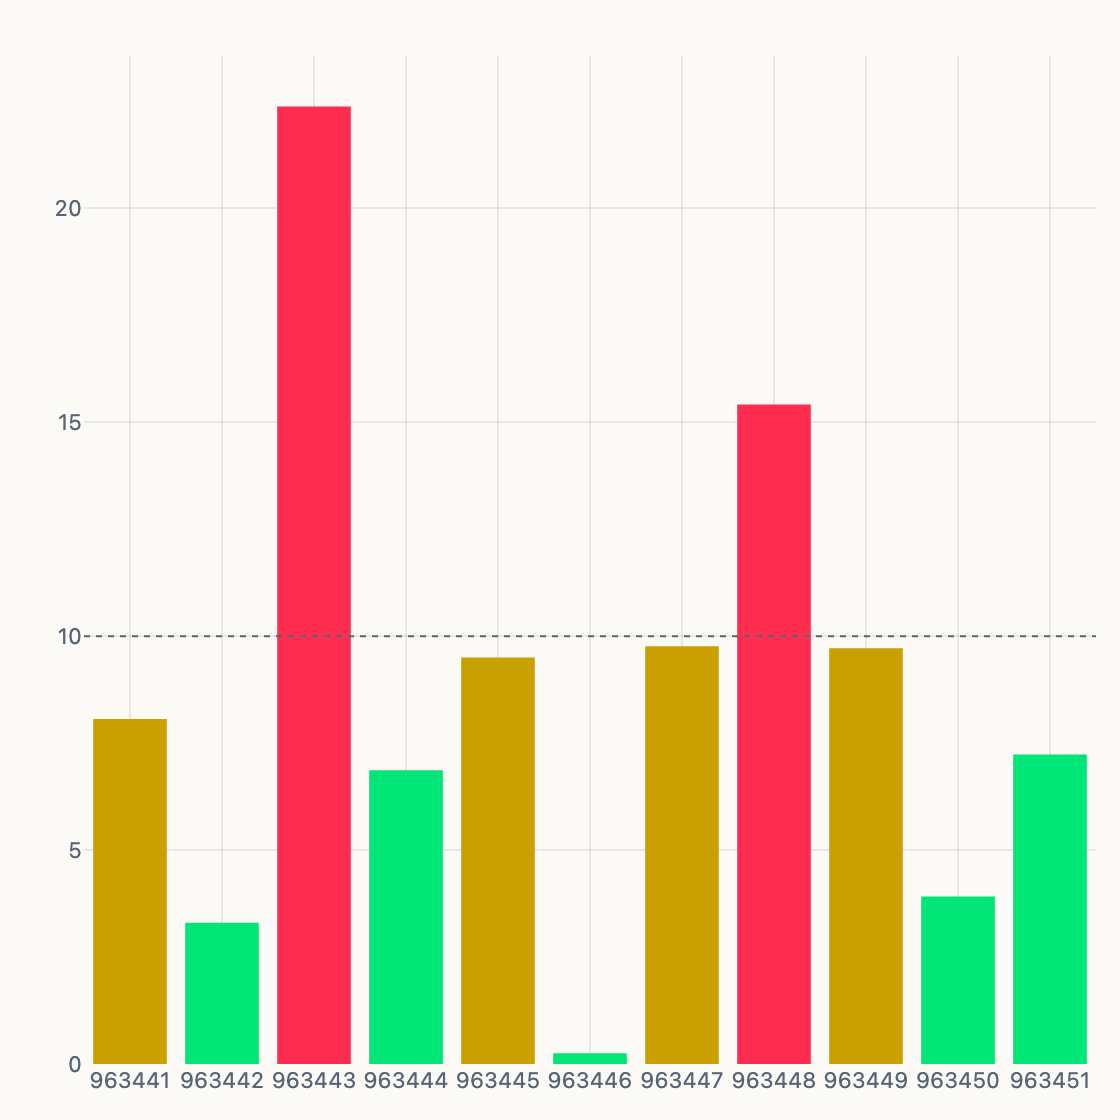
Block Interval
Minutes between recent blocks versus the 10-minute target.